Showing posts with label Productivity. Show all posts

Tuesday, May 26, 2009

Default (not going to happen... at least while we still own the printing press)

TO BE NOTED: From EconomPic Data:

"Can We Inflate Our Way out of this Mess?

Three ways the U.S. can decrease the level of nominal debt as a percent of GDP:

  • Default (not going to happen... at least while we still own the printing press)
  • Increase productivity (and GDP), while paying down or maintaining the debt load
  • Inflate our way out of it (decreases the value of debt in real terms)
Of the three, in theory, inflating our way out of it will be the easiest, as it does not require true real economic growth. In Wolfgang Munchau's recent FT article 'We Cannot Inflate our Way out of this Crisis' he states that it may not be all that easy after all. Wolfgang details:
Of course, it can be done, but only for as long as the commitment to higher inflation is credible. Inflation is not some lightbulb that a central bank can switch on and off. It works through expectations. If the Fed were to impose a long-term inflation target of, say, 6 per cent, then I am sure it would achieve that target eventually. People and markets might not find the new target credible at first but if the central bank were consistent, expectations would eventually adjust. In the end, workers would demand wage increases of at least 6 per cent each year and companies would strive to raise their prices by that amount.
Yves at Naked Capitalism agrees that it is a challenge, but possibly due to a different reason:
You may have noticed a crucial assumption...."workers will demand wage increases." Pray tell, how? Workers have no bargaining power in the US. Merely goosing interest rates does not a a tight labor market make.

Stagflation was seen as impossible until it took place. I wonder if we could wind up with rising bond yields due to concerns about large fiscal deficits, with a lower rate of goods inflation due to the lack of cost push (wages are a significant component of the cost of most goods, save highly capital intensive ones). In fact, we could see stagnant nominal wages with mildly positive inflation, which means wage deflation. If that was also accompanied by high yields, you would have much of the bad effects of debt deflation per Irving Fisher (high real yields and reduced ability to service debt) since real incomes would be falling in the most indebted cohort.
The key point is that in the current environment, workers have no power. While we all know about the spike in the unemployment rate, the other side of the story is the cliff dive in the number of new job openings. The odd thing is I first became fully aware of this information in Sunday's NY Times article Bleak Picture, Yes, But Help Still Wanted that made the case that the market was actually FULL of opportunity.
Consider that in March, nearly 700,000 jobs disappeared. But now consider this: At the end of March, there were 2.7 million job openings. What tends to get lost in the data picture is that just as some companies are laying off workers, other companies are hiring. In fact, the business world is changing at such a dizzying rate that some companies are cutting and hiring workers at the same time.
Uh.... no. 2.7 million is down from 4.8 million openings as recent as the Summer of 2007; when 6 million less people were unemployed. In other words, the number of job openings has halved, while the number of those unemployed has doubled. That is not "bleak"... that is frightening.


This in turn has pushed the number of unemployed, as a percent of job openings, up more than three-fold to 500%. Yes, for each opening... 5 people want that job. That my friends is why, as Yves points out, workers don't have ANY bargaining power.


Thus, the concern I have is that inflation won't be driven through via wage increases (where at least workers salaries are keeping up), but by a spike in the price of commodities. If inflation concerns = dollar concerns = commodity spike, then that impossible stagflation may be possible once again.

Source: BLS


Me:

Don said...

I think that defaulting on foreign debt is the easiest option politically,especially if you can convince your citizens that foreigners got you into your mess. Kind of like Ecuador today.Here, people would focus on China.

Inflation is problematic in that there will be losers in your own citizenry, and they vote.

Don the libertarian Democrat

Saturday, May 23, 2009

BlackRock Inc, the firm that is managing those vehicles, has told the central bank those holdings are likely to eventually turn a profit

TO BE NOTED: From Reuters:

"
Fed's Kohn says rates likely to stay low for some time
Sat May 23, 2009 7:20pm EDT

By Mark Felsenthal

PRINCETON, New Jersey (Reuters) - The U.S. Federal Reserve is likely to keep benchmark interest rates near zero for a while in an economy that is pulling out of a steep decline and appears on course for a very gradual recovery, Fed Vice Chairman Donald Kohn said on Saturday.

"The economy is only now beginning to show signs that it might be stabilizing, and the upturn, when it begins, is likely to be gradual amid the balance sheet repair of financial intermediaries and households," Kohn told a conference at Princeton University.

"As a consequence, it probably will be some time before the FOMC will need to begin to raise its target for the federal funds rate," he said, referring to the Fed's policy-setting Federal Open Market Committee.

The U.S. central bank has cut interest rates to near zero and committed to massive lending and securities purchases to heal shattered financial markets and pull the economy out of the longest recession since the Great Depression.

Kohn said that in spite of the fragile state of the U.S. economy and the prospect for low rates for a while, the Fed must make plain its plans to pull back its lending when a recovery begins to take hold.

"To ensure confidence in our ability to sustain price stability, we need to have a framework for managing our balance sheet when it is time to move to contain inflation pressures," he said.

The Fed has said it is willing to expand extensive purchases of mortgage-related and longer-term Treasury securities to support any nascent recovery.

"The preliminary evidence suggests that our program so far has worked," Kohn said referring to the commitments to buy securities to date. He said he believes they have held down long term interest rates by as much as 1 percentage point.

An analyst said Kohn's remarks are a signal the Fed is ready to buy more longer-term securities.

"Kohn's comments today on the effects of these actions are the most supportive to date of any Fed official and they increase the likelihood that the FOMC will extend or expand the existing asset purchase programs," JPMorgan Economics economist Michael Feroli wrote in a note to clients.

Kohn said government spending is likely to have a more powerful effect in helping pull the economy out of recession now -- with interest rates near zero -- than it would if the Fed were still in a position to lower interest rates further.

"In this situation, fiscal stimulus could lead to a considerably smaller increase in long-term interest rates and the foreign exchange value of the dollar, and to smaller decreases in asset prices, than under more normal circumstances," he added.

PRODUCTIVITY EYED

The Fed is studying how the current crisis may have affected U.S. economic productivity and how those changes may have affected the difference between how the economy grows and its full potential, he said.

"The effect of the crisis, the shifting of labor across markets, the effects on productivity have been very much one of the topics at the Fed," Kohn said in response to questions speaking.

"Right now, there's no question in my mind there's a very substantial output gap," he said.

In its actions to buttress the economy through a period of crisis, the Fed has taken on some risks both from swings in interest rates as well as from the possibilities that some borrowers could default, Kohn said, adding the Fed has sought to minimize those risks.

Even specialized vehicles such as three "Maiden Lane" limited-liability companies set up at the New York Fed to hold so-called toxic assets from two firms the central bank stepped in to prevent from failure -- investment bank Bear Stearns and insurer American International Group, Inc -- may not result in losses, he said, since the Fed is holding the assets to maturity.

BlackRock Inc, the firm that is managing those vehicles, has told the central bank those holdings are likely to eventually turn a profit, Kohn added."

how those changes may have affected the difference between how the economy grows and its full potential

TO BE NOTED: From Reuters:

"
Fed studying effect of crisis on productivity
Sat May 23, 2009 5:22pm EDT

PRINCETON, New Jersey (Reuters) - The Federal Reserve is studying how the current crisis may have affected U.S. economic productivity and how those changes may have affected the difference between how the economy grows and its full potential, Fed Vice Chairman Donald Kohn said on Saturday.

"The effect of the crisis, the shifting of labor across markets, the effects on productivity have been very much one of the topics at the Fed," Kohn said in response to questions after a conference at Princeton University.

"Right now, there's no question in my mind there's a very substantial output gap," he said."

Thursday, May 14, 2009

The paradox of high inflation is that it can make stocks, claims on productive assets very cheap

TO BE NOTED: From ducati998:

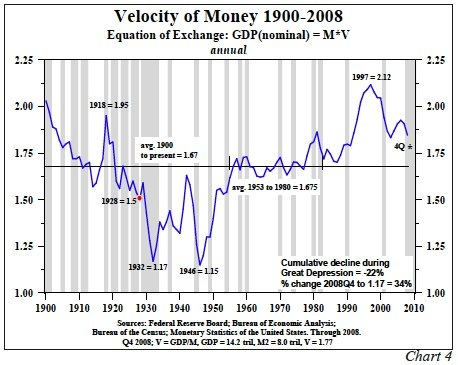
"Liquidity, velocity and stocks

snoopytyping_800x600

M2_velocity

The function of money is to facilitate exchange, and eliminate barter, thus speeding up, and expanding trade. The demand for money is increased by the following two conditions:

*Increase in productivity
*Increase in prices

The demand for money falls when the opposite conditions are operant:

*Fall in productivity
*Fall in prices

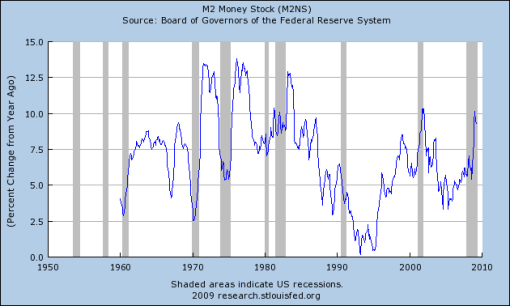
The Federal Reserve and Treasury have been increasing the volume of money within the system. Productivity has been falling, curtailed by falling demand for products & services that have excess capacity. The money supply has continued to grow.

fredgraph

Who are the recipients of the increased money supply? One of the rules of inflation is that the early recipients of new money, are allowed to buy assets with the new money thus essentially buying at a discount. The later you enter the chain, the greater the expropriation of your wealth that you will suffer.

The banks, auto-makers, and any other lame ducks that you can think of. Essentially anyone who was profilgate and stupid in combination.

What will they do with the new money? Hoarding will take place in some instances, but, many will buy assets with the money, to take advantage of a small window of opportunity of increased buying power that the new money affords.

Stocks have been rising, but the common concensus would seem to indicate that it is not Mutual Fund Managers, Pension Fund Managers etc who are driving the market. However, the banks have on aggregate, have been simply hoarding, rebuilding their capital ratios via Federal Reserve interest payments on said reserves.

Surplus money, or liquidity, needs to find a home. Rising asset prices, provide such a home. Rising prices remove liquidity, and by definition drive an increase in the demand for money.

The surplus money or liquidity, in pushing prices higher therefore eliminates the surplus supply of money, creating in time a deficit. A money deficit can be corrected through selling products/services.

What happens though when money is continuously pumped into the system? Prices will continue to rise. The Federal Reserve and other Central Banks, have not yet considered slowing the creation of new money, as, the economy, and particularly unemployment remain critical issues to their re-election, albeit, for Obama, 2.5yrs away.

Time will play a factor within the advent of an increase in liquidity and rising prices, as it takes time for the increased liquidity to leak out. Banks, as previously alluded, are not buying, rather, they are hoarding, rebuilding Balance Sheets.

Treasury paper, for psychological reasons, has been a recipient of much liquidity, although, with a failed auction last week, this asset class may well start leaking liquidity back into alternate assets. Banks, Pension Funds and Sovereign holders constitute major players.

China, is not happy. China has already made noises with regard to replacing the US dollar as the Reserve Currency. China will not be blind to the threat of increased liquidity within the Banks and what it must eventually mean. As a country in surplus, as opposed to a US deficit, China can withdraw liquidity, at no discount, due to US liquidity provision via Quantitative Easing, and reallocate this liquidity, [this holds true for Petro-dollars etc]

Where would this liquidity flow to?

The paradox of high inflation is that it can make stocks, claims on productive assets very cheap. Asia and South American inflations of recent times bear this out.

Although the official inflation rate is negligible, the creation of so much new money has created the potential of a serious inflation should it be released, highly possible."

Wednesday, May 13, 2009

Given the choice, erring on the side of inflation would be less catastrophic than erring on the side of deflation.

TO BE NOTED: From the Economist:

"Deflation in America

The greater of two evils
May 7th 2009
From The Economist print edition


Inflation is bad, but deflation is worse


MERLE HAZARD, an unusually satirical country and western crooner, has captured monetary confusion better than anyone else. “Inflation or deflation,” he warbles, “tell me if you can: will we become Zimbabwe or will we be Japan?”

How do you guard against both the deflationary forces of America’s worst recession since the 1930s and the vigorous response of the Federal Reserve, which has in effect cut interest rates to zero and rapidly expanded its balance-sheet? On May 4th Paul Krugman, a Nobel laureate in economics, gave warning that Japan-style deflation loomed, even as Allan Meltzer, an eminent Fed historian, foresaw a repeat of 1970s inflation—both on the same page of the New York Times.

There is something to both fears. But inflation is distant and containable, while deflation is at hand and pernicious.


Fears about deflation do not rest on the 0.4% decline in American consumer prices in the year to March. Although this is the first such annual decline since 1955, it is the transitory result of a plunge in energy prices. Excluding food and energy, core inflation is 1.8%. Rather, the worry is of persistent price declines that characterise true deflation. With unemployment nearing 9%, economic output is further below the economy’s potential than at any time since 1982. This gap is likely to widen. House prices are not part of America’s inflation index but their decline is forcing households to reduce debt (see article), which could subdue economic growth for years. As workers compete for scarce jobs and firms underbid each other for sales, wages and prices will come under pressure.

So far, expectations of inflation remain stable: that sentiment is itself a welcome bulwark against deflation. But pay freezes and wage cuts may soon change people’s minds. In one poll, more than a third of respondents said they or someone in their household had suffered a cut in pay or hours. The employment-cost index rose by just 2.1% in the year to the first quarter, the least since records began in 1982. In 2003, during the last deflation scare, total pay grew by almost 4%.

Does this matter? If prices are falling because of advancing productivity, as at the end of the 19th century, it is a sign of progress, not economic collapse. Today, though, deflation is more likely to resemble the malign 1930s sort than that earlier benign variety, because demand is weak and households and firms are burdened by debt. In deflation the nominal value of debts remains fixed even as nominal wages, prices and profits fall. Real debt burdens therefore rise, causing borrowers to cut spending to service their debts or to default. That undermines the financial system and deepens the recession.

From 1929 to 1933 prices fell by 27%. This time central banks are on the case. In America, Britain, Japan and Switzerland they have pushed short-term interest rates to, or close to, zero and vastly expanded their balance-sheets by buying debt. It helps, too, that the world has abandoned the monetary straitjacket of the gold standard it wore in the 1930s.

Yet this anti-deflationary zeal is precisely what alarms people like Mr Meltzer. He worries that the price of seeing off deflation is that the Fed will be unable or unwilling to reverse itself in time to prevent a resurgence of inflation.

Fair enough, but inflation is easier to put right than deflation. A central bank can raise interest rates as high as it wants to suppress inflation, but it cannot cut nominal rates below zero. Deflation robs a central bank of its ability to stimulate spending using negative real interest rates. In the worst case, rising debts and defaults depress growth, poisoning the economy by deepening deflation and pressing real interest rates higher. Central banks that have lowered rates to nearly zero are now using unconventional, quantitative tools, but their efficacy is unproven. Given the choice, erring on the side of inflation would be less catastrophic than erring on the side of deflation.

That said, there is a legitimate concern that when the time comes to raise interest rates, the Fed may hold back because of political pressure or fear of fracturing financial markets. The Fed was too slow to raise interest rates after its deflation scare in 2003. Yet that is best addressed by strengthening the Fed. Barack Obama should nominate credible, independent people to the two vacant seats on the Federal Reserve Board, and bat away suggestions that the 12 reserve-bank presidents, who are not confirmed by Congress, lose their say in monetary policy. Congress should let the Fed issue its own debt, which would give it scope to tighten monetary policy without disorderly sales of the illiquid private debt it has taken on.

Affirming the Fed’s political independence and equipping it with better tools would help the central bank combat inflation when the time comes. It would also lessen the risk that it tightens prematurely just to demonstrate its resolve."

Thursday, March 5, 2009

Productivity declined 0.4 percent in the nonfarm business sector in fourth-quarter 2008, as output fell faster than hours

TO BE NOTED:

"
Productivity and Costs, Fourth Quarter and Annual Averages, 2008 Revised

Internet address: http://www.bls.gov/lpc/ USDL 09-0223
Historical, technical TRANSMISSION OF THIS
information: (202) 691-5606 MATERIAL IS EMBARGOED
Current data: (202) 691-5200 UNTIL 8:30 A.M. EST,
Media contact: (202) 691-5902 THURSDAY, MARCH 5, 2009


PRODUCTIVITY AND COSTS
Fourth Quarter and Annual Averages, 2008 Revised


The Bureau of Labor Statistics of the U.S. Department of Labor today
reported revised fourth-quarter seasonally-adjusted annual rates of
productivity change--as measured by output per hour of all persons--and
revised changes for calendar year 2008. Percent changes in business and
nonfarm business productivity were:

Fourth Annual averages
quarter 2007-2008

Business sector -0.4 2.7
Nonfarm Business sector -0.4 2.8


Productivity growth for the fourth quarter of 2008 was revised down by
3.5 percentage points( !!! DON ) in the business sector and 3.6 percentage points ( !!! DON )in the
nonfarm business sector from the estimates published February 5. In both
sectors output was revised down by 3.2 percentage points and hours were
revised up by 0.1 percentage point. Productivity growth during calendar year
2008 was not revised in either sector.

In the manufacturing sector, percent changes in productivity were:

Fourth Annual averages
quarter 2007-2008

Manufacturing sector -4.0 1.5
Durable goods manufacturing -14.8 1.6
Nondurable goods manufacturing 7.6 1.0


==============================================================================
Data in this release reflect annual benchmark revision of BLS Current
Employment Statistics program data on nonfarm employee hours, and revised
seasonal adjustment of those data. Also, hours of other nonfarm and farm
workers based on the BLS Current Population Survey incorporate new seasonal
adjustment factors. Due to these revisions, hours measures for all major
sectors were revised back to the first quarter of 2004 and appear in detail
in tables 1 through 6 and appendix tables 1 through 6. See Revised
Measures.
==============================================================================


In the manufacturing sector, productivity fell 1.0 percentage point
more than was reported Feb. 5, as a 1.0 percentage point downward revision to
output was partially offset by a 0.1 percentage point downward revision to
hours. Annual average growth in manufacturing productivity from 2007 to 2008
was revised up by 0.2 percentage point. Output and hours in manufacturing,
which includes about 12 percent of U.S. business-sector employment, tend to
vary more from quarter to quarter than data for the aggregate business and
nonfarm business sectors. Fourth-quarter productivity and related measures
are summarized in table A and appear in detail in tables 1 through 5.
Preliminary and revised fourth-quarter and annual data appear in table C.


------------------------------------------------------------------------------
Table A. Productivity and costs: Revised fourth-quarter 2008 measures
(Seasonally adjusted annual rates)
------------------------------------------------------------------------------
Real
Hourly hourly Unit
Produc- compen- compen- labor
Sector tivity Output Hours sation sation costs
------------------------------------------------------------------------------
Percent change from preceding quarter

Business -0.4 -8.4 -8.0 5.0 15.6 5.4
Nonfarm Business -0.4 -8.7 -8.3 5.3 15.9 5.7
Manufacturing -4.0 -17.7 -14.2 10.1 21.2 14.7
Durable -14.8 -26.9 -14.2 10.1 21.2 29.1
Nondurable 7.6 -7.7 -14.2 10.1 21.3 2.3
------------------------------------------------------------------------------
Percent change from same quarter a year ago

Business 2.2 -1.8 -3.9 4.0 2.5 1.8
Nonfarm Business 2.2 -1.8 -4.0 4.1 2.5 1.8
Manufacturing -1.1 -8.0 -6.9 5.6 4.0 6.8
Durable -3.5 -10.6 -7.4 6.0 4.4 9.8
Nondurable 0.8 -5.3 -6.1 4.9 3.3 4.1
------------------------------------------------------------------------------


The data sources and methods used in the preparation of the
manufacturing series differ from those used in preparing the business and
nonfarm business series, and these measures are not directly comparable.
Output measures for business and nonfarm business are based on measures of
gross domestic product prepared by the Bureau of Economic Analysis of the
U.S. Department of Commerce. Quarterly output measures for manufacturing
reflect indexes of industrial production prepared by the Board of Governors
of the Federal Reserve System. See Technical Notes for further information
on data sources.


Business

Productivity in the business sector decreased 0.4 percent in the
fourth quarter of 2008, as output decreased 8.4 percent and hours of all
persons decreased 8.0 percent (seasonally adjusted annual rates). The decline
in output was the largest since the first quarter of 1982 (-8.6 percent) and
the decline in hours was the largest since the first quarter of 1975 (-12.1
percent). When the fourth quarter of 2008 is compared to the fourth quarter
of 2007 output per hour increased 2.2 percent (tables A and 1).

Hourly compensation grew at a 5.0 percent annual rate in the fourth
quarter. This measure includes wages and salaries, supplements, employer
contributions to employee-benefit plans, and taxes. Real hourly compensation
increased 15.6 percent in the fourth quarter. This measure takes into
account changes in consumer prices, which fell at a 9.2 percent annual rate
in the fourth quarter.

Unit labor costs, which reflect changes in hourly compensation and
productivity, increased 5.4 percent during the fourth quarter, after rising
3.3 percent in the third quarter. The implicit price deflator for business
sector output edged down 0.1 percent in the fourth quarter of 2008, but
increased 1.7 percent from the same quarter a year ago.


Nonfarm Business

In the nonfarm business sector, productivity decreased at an annual
rate of 0.4 percent in the fourth quarter of 2008, as output decreased 8.7
percent and hours of all persons--employees, proprietors, and unpaid family
workers--decreased 8.3 percent. As in the business sector, the decline in
nonfarm business output was the largest since the first quarter of 1982 (-8.7
percent) and the decline in hours was the largest since the first quarter of
1975 (-12.0 percent). Productivity increased 2.2 percent during the last
four quarters (table 2).

Hourly compensation grew 5.3 percent in the fourth quarter of 2008.
Real hourly compensation rose steeply, 15.9 percent, when the 9.2 percent
decrease in consumer prices was taken into account. This was the largest
increase in the real hourly compensation series, which begins in the second
quarter of 1947. As in the business sector, real hourly compensation rose
2.5 percent during the past four quarters.

Unit labor costs increased 5.7 percent in the fourth quarter and 1.8
percent over the last four quarters. The implicit price deflator for nonfarm
business increased 0.5 percent in the fourth quarter after increasing 4.7
percent in the previous quarter.


Manufacturing

Manufacturing productivity, output, and hours all declined in the
fourth quarter of 2008; output per hour fell 4.0 percent, output dropped 17.7
percent, and hours fell 14.2 percent. These were the largest declines for
each of these series, which begin with data for the second quarter of 1987.
From the fourth quarter of 2007 to the fourth quarter of 2008 manufacturing
productivity decreased 1.1 percent, output fell 8.0 percent and hours fell
6.9 percent (table A).

In the durable goods manufacturing sector, productivity dropped 14.8
percent in the fourth quarter of 2008, as output fell 26.9 percent and hours
declined 14.2 percent. These were the largest decreases in output and output
per hour for the entire series beginning in the second quarter of 1987. In
the nondurable goods sector, productivity rose 7.6 percent in the fourth
quarter as hours fell faster than output; output declined 7.7 percent and
hours fell 14.2 percent.

Hourly compensation of all manufacturing workers increased 10.1
percent during the fourth quarter of 2008, and after taking into account the
9.2 percent decrease in consumer prices, real hourly compensation in
manufacturing rose a series-high 21.2 percent. Hourly compensation also rose
10.1 percent in durable and nondurable manufacturing; real hourly
compensation increased 21.2 percent and 21.3 percent, respectively.

Unit labor costs in manufacturing increased 14.7 percent in the fourth
quarter of 2008. These cost increases were concentrated in durable goods
manufacturing where unit labor costs rose 29.1 percent; unit labor costs rose
2.3 percent in nondurable goods industries. Over the last four quarters
manufacturing unit labor costs increased 6.8 percent.


ANNUAL AVERAGE CHANGES, 2007-2008


Business and Nonfarm Business

When annual averages for 2008 were compared with annual averages for
2007, labor productivity increased 2.7 percent in the business sector and 2.8
percent in the nonfarm business sector (table B). In both sectors, the
productivity gains were the largest since 2004, due more to declines in hours
than the small gains in output, and were larger than the 2.5 percent average
annual increase during the 2000-2007 period.

In 2008, hourly compensation increased 3.6 percent and 3.7 percent in
the business and nonfarm business sectors, respectively. Because consumer
prices increased more, 3.8 percent, real hourly compensation fell slightly.
The annual decline in this measure of purchasing power was the first since
small declines occurred in three consecutive years--1993, 1994, and 1995.

Unit labor costs rose just 0.9 percent in both the business and
nonfarm business sectors during 2008, as hourly compensation growth was
largely offset by productivity growth. Unit labor costs had increased 1.4
percent from 2000 to 2007 in both sectors.


------------------------------------------------------------------------------
Table B. Productivity and costs: Revised 2008 annual averages
(Seasonally adjusted annual rates)
------------------------------------------------------------------------------
Real
Hourly hourly Unit
Produc- compen- compen- labor
Sector tivity Output Hours sation sation costs
------------------------------------------------------------------------------
Percent change from previous year

Business 2.7 0.8 -1.9 3.6 -0.2 0.9
Nonfarm Business 2.8 0.8 -1.9 3.7 -0.1 0.9
Manufacturing 1.5 -2.5 -3.9 4.0 0.2 2.5
Durable 1.6 -2.6 -4.2 4.2 0.3 2.5
Nondurable 1.0 -2.4 -3.4 3.8 0.0 2.8
------------------------------------------------------------------------------


Manufacturing

In the manufacturing sector, labor productivity rose 1.5 percent in
2008 as output fell 2.5 percent but hours fell faster, 3.9 percent (table B).
Durable manufacturing output per hour increased 1.6 percent as output fell
2.6 percent and hours fell 4.2 percent, while in nondurable goods industries
productivity increased 1.0 percent, output fell 2.4 percent and hours fell
3.4 percent. Total manufacturing productivity had grown at a 3.7 percent
average annual rate from 2000 to 2007.

Hourly compensation of manufacturing workers increased 4.0 percent in
2008, which is the same as the average annual rate of growth from 2000 to
2007. The gain in hourly compensation was offset by the 3.8 percent increase
in consumer prices, and real hourly compensation edged up 0.2 percent. Unit
labor costs in manufacturing increased 2.5 percent in 2008, as hourly
compensation increased more than productivity. These costs had increased at
a 0.3 percent average annual rate from 2000 to 2007.


------------------------------------------------------------------------------
Table C. Previous and revised productivity and related measures:
Fourth-quarter 2008, third-quarter 2008, and annual averages 2008
(Seasonally adjusted annual rates)
------------------------------------------------------------------------------
Real
Hourly hourly Unit
Produc- compen- compen- labor
Sector tivity Output Hours sation sation costs
------------------------------------------------------------------------------
Percent change, fourth quarter 2008

Business:
Previous 3.1 -5.2 -8.1 4.7 15.3 1.5
Revised -0.4 -8.4 -8.0 5.0 15.6 5.4
Nonfarm Business:
Previous 3.2 -5.5 -8.4 5.0 15.6 1.8
Revised -0.4 -8.7 -8.3 5.3 15.9 5.7
Manufacturing:
Previous -3.0 -16.7 -14.1 9.8 20.9 13.3
Revised -4.0 -17.7 -14.2 10.1 21.2 14.7
------------------------------------------------------------------------------
Percent change, third quarter 2008

Business:
Previous 1.7 -1.8 -3.5 4.2 -2.3 2.5
Revised 2.3 -1.8 -4.0 5.7 -1.0 3.3
Nonfarm Business:
Previous 1.5 -1.9 -3.4 4.2 -2.4 2.6
Revised 2.2 -1.9 -3.9 5.7 -0.9 3.5
Manufacturing:
Previous -3.3 -8.8 -5.7 4.9 -1.7 8.4
Revised -2.2 -8.6 -6.5 5.4 -1.3 7.8
------------------------------------------------------------------------------
Percent change, 2007 - 2008

Business:
Previous 2.7 1.0 -1.7 3.3 -0.5 0.6
Revised 2.7 0.8 -1.9 3.6 -0.2 0.9
Nonfarm Business:
Previous 2.8 1.0 -1.8 3.4 -0.4 0.5
Revised 2.8 0.8 -1.9 3.7 -0.1 0.9
Manufacturing:
Previous 1.3 -2.4 -3.7 3.9 0.1 2.5
Revised 1.5 -2.5 -3.9 4.0 0.2 2.5
------------------------------------------------------------------------------


Revised Measures


Quarterly and annual measures for all sectors were revised back to
2004 to incorporate the annual benchmark adjustment and updated information on
seasonal trends from the BLS nonfarm payroll series (table C and appendix
tables 1-5). Hours and related measures for the business and nonfarm
business sectors were revised to incorporate updated information on seasonal
trends in Current Population Survey data on hours worked. Full quarterly and
annual historical series are available on the BLS website,
http://www.bls.gov/lpc/#data .

Previous and revised productivity and related data for the third
quarter, fourth quarter, and full year 2008 for business, nonfarm business,
and manufacturing are displayed in Table C. In the business and nonfarm
business sectors, productivity declined 0.4 percent in the fourth quarter of
2008, rather than increasing as reported Feb. 5. In both sectors, this
resulted from a 3.2 percentage points downward revision to output, with hours
little changed. Also in both sectors, the downward revisions to productivity
and the 0.3 percentage point upward revisions to hourly compensation resulted
in upward revisions to unit labor costs of 3.9 percentage points.

In the manufacturing sector, fourth-quarter productivity growth was
revised down from -3.0 percent to -4.0 percent, due to the 1.0 percentage
point downward revision to output; hours were revised down slightly. The
combination of the downward revision to productivity and a small upward
revision to hourly compensation led to an upward revision in unit labor costs
from 13.3 percent to 14.7 percent.

Productivity growth was revised up in the business and nonfarm
business sectors for the third quarter, due solely to downward revisions to
hours; output was not revised. In the manufacturing sector, productivity
declined less than previously reported, reflecting a downward revision to
hours and a slight upward revision to output. Unit labor costs were revised
up in the business and nonfarm business sectors for the third quarter, while
they were revised down in the manufacturing sector.

For the year 2008, productivity grew at the same rates reported Feb. 5
in both the business and nonfarm business sectors--2.7 percent and 2.8
percent, respectively. Because hourly compensation was revised up in these
two sectors, unit labor costs were revised up as well. In the manufacturing
sector, an upward revision to productivity was offset by an upward revision
to hourly compensation, leading to unit labor costs not being revised.


Revised measures: Nonfinancial corporations

Measures for the nonfinancial corporate sector also were revised today
to incorporate new information regarding output and compensation in the third
quarter of 2008. Productivity growth was revised up from the preliminary
estimate due to an upward revision to output and a downward revision to
hours. Hourly compensation had an upward revision which, when paired with
the upward revision to productivity, led to a slight upward revision to unit
labor costs.


------------------------------------------------------------------------------
Table D. Nonfinancial corporations: Previous and revised productivity and
cost measures
Quarterly percent changes at seasonally adjusted annual rates
------------------------------------------------------------------------------
Real
Hourly hourly Unit Implicit
Produc- compen- compen- labor Unit price
tivity Output Hours sation sation costs profits deflator
------------------------------------------------------------------------------
Third quarter 2008

Previous 5.5 2.1 -3.2 5.1 -1.5 -0.4 26.8 3.8
Revised 6.4 2.3 -3.9 6.1 -0.6 -0.3 26.5 3.8
------------------------------------------------------------------------------


Next release date

The next release of Productivity and Costs is scheduled for 8:30 A.M.
EDT, Thursday, May 7, 2009, and will present preliminary first-quarter 2009
measures for business, nonfarm business, and manufacturing. Fourth-quarter
2008 and annual average data for 2008 for nonfinancial corporations will be
released at that time.


Tuesday, December 30, 2008

"employment in manufacturing (as reflected in the total number of hours worked) did not recover as it usually does following a recession."

Yves Smith is deeply worried about this issue. From the CBO Director's Blog:

"
Decline in U.S. Manufacturing Employment

CBO released an economic and budget issue brief today that discusses the factors underlying the decline in manufacturing employment over the past several years. The manufacturing sector of the U.S. economy has experienced substantial job losses since 2000. During the recession of 2001 and its immediate aftermath, employment in the manufacturing sector fell by about 2.9 million jobs, or 17 percent. Even after overall employment began to improve in 2004, the decline in manufacturing employment persisted. By the end of 2007, with the slowing of economic growth, employment in the sector had edged down further, by half a million jobs. And, as of November 2008, employment in manufacturing had fallen yet again, by slightly more than 600,000 jobs. A significant number of additional losses is likely given the current weakness in the economy. ( IT'S A BIG HIT FOR THIS JOB SECTOR )

Although the decline in manufacturing employment in recent years is not a departure from long-standing trends—the sector’s share of total employment has been falling steadily for more than half a century—the recession of 2001 hit manufacturing particularly hard. And, in sharp contrast to the pattern observed during previous expansions, employment in manufacturing (as reflected in the total number of hours worked) did not recover as it usually does following a recession.

The decline in manufacturing employment between 2000 and 2007 stemmed as much from an absence of new hiring as it did from layoffs of individual workers and downsizing. Rates of both job losses and job gains have been lower since the 2001 recession than they were in the 1990s. Workers who lost jobs, however, have typically experienced longer stretches of unemployment than did workers who lost jobs in the previous decade.

The steep decline in manufacturing employment since 2000 is associated with two interrelated developments:( 1 ) rapid gains in productivity (output per hour) in U.S. manufacturing and ( 2 )increased competition from foreign producers. Productivity in manufacturing has risen by about one-third since 2000( THAT'S AMAZING ), and growth in that productivity has consistently exceeded that of the overall nonfarm business sector.

Competition from overseas helped spur U.S. firms to boost productivity, but that competition has also dampened demand for goods produced in the United States, despite domestic manufacturers’ efforts to reduce costs through productivity enhancements. Those same developments have also had some beneficial effects for many U.S. residents, including the ability to buy manufactured goods at relatively low prices( TRUE. IT'S A TRADE OFF ).

This decline in manufacturing employment represents a reallocation of jobs among industries rather than a decline in total employment in the United States. Until recently, other sectors of the economy have more than compensated in terms of overall employment, as evidenced by the relatively low 4.7 percent unemployment rate that existed during early 2007 and the roughly 7.5 million net new jobs created in the U.S. between early 2004 and the end of 2007.

This brief was prepared by David Brauer with the assistance of Eric Miller, both of CBO’s Macroeconomic Analysis Division."

Yves Smith's solution seems to be Managed Trade to enable our economy to keep some of the high end manufacturing jobs. I'm of two minds about this, because, while I believe in free trade, we don't have it, any more than we have a free market. Both are hybrids in which government is heavily and essentially involved.

So, my answer is that I would have to see the proposal about managed trade, in order to assess its efficacy and reciprocity.

Friday, December 26, 2008

"However, might real GDP actually grow Q3-Q4?"

Casey Mulligan with another bold prediction:

"I think that the forecasts of real GDP growth rates Q3-Q4 of -5 to -6 percent (annualized) are too pessimistic. However, might real GDP actually grow Q3-Q4?

PRODUCTIVITY ANGLE
We have employment and hours numbers for Oct and Nov already saying that aggregate labor hours growth Q3-Q4 (annualized) will be -7 to -8 percent. That means that real GDP growth requires total factor productivity (this is different from hourly productivity I have discussed in previous posts -- TFP is how much GDP would grow if labor were constant) to increase 5 percent or more. That's more than the trend productivity in the recent past, so the odds must be less than 50%.

Productivity growth (for one quarter, at annual rates) has been 5% or more during previous recoveries. It happened two quarters in a row starting 6 quarters after the start of the 1981-82 recession. It happened 4 quarters after the start of the 1990 recession, and again 3 quarters later. It happened 3 times in the year following the start of the 2001 recession. Interestingly, the 2001 recession was a recession with very little quarter-to-quarter productivity decline (this recession has none). This tells me that the odds are not negligible.

Also note that there was a major hurricane and a strike in Q3, which were gone by Q4. This by itself would create a bit of productivity growth.

PERSONAL INCOME ANGLE
I am confident that personal income deflated with the CPI will be higher in Q4 than in Q3, given that it is already so much higher in Oct and Nov than it was in Q3. The GDP deflator tends to be less volatile than the CPI, so personal income deflated by the GDP deflator will likely grow less. However, given that Oct and Nov NOMINAL personal income are a bit higher than the Q3 average and that the GDP deflator will fall Q3-Q4 (albeit less sharply than the CPI), it seems that personal income deflated by the GDP deflator will grow Q3-Q4 about 1 percent = 4 percent annualized.

From this perspective, the question is whether GDP could grow one percent (4 percent annualized) less than personal income. The differences between GDP and personal income include depreciation, retained earnings, net factor income paid to foreigners, and bunch of public sector items (plus estimation error in going from monthly to quarterly). Personal income is about 85% of GDP, so the residual between them would have to shrink by 7 percent (= 28 percent annualized) in order for GDP to grow 1 percent less than personal income. This another reason why I see a significant likelihood that real GDP growth Q3-Q4 is closer to real personal income growth, and thereby positive.


MY FORECAST
My point estimate for real GDP growth Q3 to Q4 is -2.5% (annualized rate). I get this by assuming that TFP follows trend (about 2% annualized; remember that I see that not much is happening with labor demand) and that labor falls 7%. 2 - (7 * labor's share) = -3. Then I add a little because personal income has done surprisingly well in November.

[some handwaving ...] Probability (real GDP Q4 higher than real GDP Q3) = 0.33."

Why not agree? As you know, I agree with him, but for different reasons. I believe that much of the job loss was proactive and uncalled for. That's why Productivity rose. Therefore, I'm committed to the view that the Fundamentals are in better shape than the forecasts, which are helping to drive this proactive job loss. Nothing is written, and, in a Human Agency Model, Expectations can effect human behavior, and so can change the facts by changing behavior. But no one is really following my predictions, and I'm a philosopher, and basing my conclusions on a philosophical analysis of human behavior to help understand this crisis. So, again, why not agree ?

"but the critics never mention the reason for the low rates nor their benefits."

Bob McTeer takes the blame for turning the water on in the Spigot Theory, which I don't credit:

"When recession becomes an issue, as it now is, the remedy involves increasing total spending, or aggregate demand, to match the capacity of the economy to produce goods and services at full employment( TRUE ).

One way to view aggregate demand is by its spending components such as consumption, investment, and government spending. This "Keynesian approach facilitates a focus on fiscal policy( TRUE ).

An equally valid approach that highlights monetary policy is to treat aggregate demand as the money supply (M) times its velocity (V). MV gives you the same spending totals as above( YES ).

A third approach, rarely used, is productivity (output per hour worked) times the number of hours worked. That too gives the same result. It's like describing the same thing in different languages.( OK )

Productivity growth came into prominence in the late 1990s because its acceleration had very positive results. It enabled employers to give pay increases without increasing their unit labor costs. That permitted an easier monetary policy with less worry about inflation. We had faster growth with falling inflation( YES ).

Remarkably, faster productivity growth continued as we climbed out of the recession in 2002. That was a mixed blessing since business expanded with little or no expansion in employment. Rising output coinciding with rising unemployment led to the term "jobless recovery."( YES. THAT'S SOMETIMES AN ODDITY OF AN INCREASE IN PRODUCTIVITY )

While rising productivity was increasing our standard of living, it also depressed employment growth, which is probably not a desirable tradeoff when the economy is weak( I AGREE ). Rising employment spreads the benefits of growth more widely( YES ).

As 2002 progressed, the recovery sputtered and a double dip recession threatened. Falling inflation threatened to morph into actual deflation. Fear of deflation, was the main reason the Greenspan Fed allowed the Federal funds rate to go so low, eventually reaching one percent. Alan Greenspan is routinely blamed for those low interest rates fueling the housing boom, but the critics never mention the reason for the low rates nor their benefits( TRUE. SAME PLAN AS THIS TIME ).

Whether the policy was justified or not, I left my fingerprints at the scene. At the September 2002 FOMC meeting, I dissented, along with Governor Ned Gramlich, in favor of reducing rates. We didn't prevail at that meeting, but the vote to ease was unanimous at the next meeting, on November 6.

I wrote the following rational for the minutes, which are now public:

Messrs. Gramlich and McTeer dissented because they preferred to ease monetary policy at this meeting. The economic expansion, which resumed almost a year ago, had recently lost momentum, and job growth had been minimal over the past year. With inflation already low and likely to decline further in the face of economic slack and rapid productivity growth, the potential cost of additional stimulus seemed low compared with the risk of further weakness.

So, you see, it wasn't Chairman Greenspan's fault. It was mine."

I would have voted with McTeer. But, as I say, I don't hold Low Interest Rates as the cause of our crisis. My main complaint against Greenspan is not recognizing problems and voicing concerns about them. He was too much of a cheerleader for some dubious views about current Political Economy.

Wednesday, December 24, 2008

"The second type of explanation is reduced labor supply. "

Casey Mulligan with a post that irked a few readers, which is what I bet the NY Times wants. As usual, I'm going to take Casey's views and turn them into mine. I will take his Economic Points and turn them into my Political Economy Points. I doubt he'll mind, since he doesn't know:

"
Are Employers Unwilling to Hire, or Are Some Workers Unwilling to Work?

Casey B. Mulligan is an economist at the University of Chicago.

President-elect Barack Obama was not the first University of Chicago professor to serve in the United States Senate. More than 50 years ago, a professor named Paul Douglas became a United States senator representing Illinois.

As an economics professor, Professor Douglas wrote about the supply and demand for labor. Some of his techniques can lead us to a surprising conclusion about today’s recession: The recent decrease in employment may be due less to employers’ unwillingness to hire more workers( DEMAND ) and more to workers’ unwillingness to work( SUPPLY ).

As you’ve probably heard, employment has been falling over the past year. After peaking in December 2007, employment fell 1.4 percent over the next 11 months. Hours per employee also fell. As a result, if total hours worked had continued the upward trend they had been on in the years before the recession, they would be 4.7 percent higher than they are now.

Explanations for the decline — like most everything in economics — can be classified in two ways: supply or demand.

In many recessions, the demand for labor gets much of the blame. The demand explanation says that, with orders for their products down, many companies have trouble finding productive uses for employees. Some workers are then let go( I SAY THAT THIS IS HAPPENING OUT OF FEAR ). In this view, productivity — the amount produced per hour worked — should decline because reduced productivity is a driving force of layoffs. (Gross domestic product thereby declines for two reasons: fewer workers and less productivity per worker.)

Indeed, hourly productivity did decline in the 1981-82 recession, falling three out of four quarters for a cumulative peak-to-trough decline of 2.3 percent. Productivity fell faster and longer during the Depression.

The second type of explanation is reduced labor supply( SUPPLY ).

Suppose, just for the moment, that people were less willing to work, with no change in the demand for their services. This means that employees would have to be more productive because they have to get by with fewer workers.

Of course, people have not suddenly become lazy, but the experiment gives similar results to the actual situation in which some employees face financial incentives that encourage them not to work and some employers face financial incentives not to create jobs( HERE'S WHERE I SEE THE PROBLEM ).

Professor Douglas gave us a formula for determining how much output per work hour would increase as a result of a reduction in the aggregate supply of hours: For every percentage point that the labor supply declines, productivity would rise by 0.3 percentage points.

As mentioned earlier, in late 2008, labor hours were 4.7 percent below where trends from previous years would predict the number to be. According to Professor Douglas’s theory, this means productivity should rise 1.4 percent above its previous trend by the fourth quarter.

So let’s take a look at the numbers. Unlike in the severe recessions of the 1930s and early 1980s, productivity has been rising( TRUE ). Through the third quarter of 2008, productivity had risen six consecutive quarters, with an increase of 1.9 percent over the past three, or 0.7 percent above the trend for the previous 12 quarters.

Because productivity has been rising — almost as much as the Douglas formula predicts — the decreased employment is explained more by reductions in the supply of labor (the willingness of people to work) and less by the demand for labor (the number of workers that employers need to hire).

Why would some people have fewer incentives to take a job in 2008 than they did in 2006 and 2007 (and employers fewer incentives to create jobs)?

I will tackle that question in my next post, but even without a specific answer we learn a lot about today’s recession from the conclusion that labor supply – not labor demand – should be blamed. First of all, it suggests that a fundamental solution to the recession would encourage labor supply (perhaps cutting personal income tax rates, so people can keep more of their wages), rather than tinker with demand.

Second, the recent supply reduction may be more short-lived than the demand reductions of past severe recessions. In particular, as people adjust to the reality of depleted retirement accounts and vanished home equity, many of them will decide to make up for some of the shortfall by working more and retiring later.

And on another note, the department of economics at the University of Chicago does not conform to stereotypes: Professor Douglas ran for senator on the Democratic Party ticket and was occasionally accused of being a socialist. I teach his formula frequently and with admiration."

I take the rising productivity and rising unemployment to show that many people are proactively and needlessly being laid off out of fear and aversion to risk. There is rising Productivity because the Demand is still the same, yet there are fewer workers. And there are fewer workers because the layoffs are due to the fear and aversion to risk.

The reason that the fear and aversion to risk mimics the behavior of an increase in the supply of workers, is because workers are being proactively and needlessly let go, not due to the fundamentals of supply and demand. It is a case of employers misreading and misdirecting the supply and demand now prevailing. After all, in order for supply and demand to work, it has to be perceived by acting human agents.

So, my thesis is that letting people go because you assume that demand will decrease, when demand doesn't decrease, leads to a rise in productivity and a seeming rise in labor supply, which it is, only not because the workers don't want to work, but because the employers have proactively and erroneously let them go, from misperceiving the demand.

It would follow that things might be better than we think, and that employers might soon realize the need for extra workers. At least that's the hope.

Conversely, some kind of stimulus of demand would work, since employers would soon perceive the need for more workers. I leave the details of the stimulus for another time.

Thursday, December 18, 2008

Are Sticky Wages Stickier Than Sticky Buns?

Felix Salmon posts about the idea that employers don't like to reduce wages in a recession or economic downturn:

"David Leonhardt on deflation, Wednesday:

The drop in prices, which isn't over yet, will make life easier on millions of people. It's possible, in fact, that the current recession will do less harm to the typical family's income than it does to many other parts of the economy.
The reason is something called the sticky-wage theory. Economists have long been puzzled by the fact that most businesses simply will not cut their workers' pay, even in a downturn. Businesses routinely lay off 10 percent of their workers to cut costs. They almost never cut pay by 10 percent across the board.

Fedex press release, Thursday:

FedEx is now implementing a number of additional cost reduction initiatives to mitigate the effects of deteriorating business conditions, including:
Base salary decreases, effective January 1, 2009:
* 20% reduction for FedEx Corp. CEO Frederick W. Smith
* 7.5%-10.0% reduction for other senior FedEx executives
* 5.0% reduction for remaining U.S. salaried exempt personnel

Fedex is largely non-union, which means that most workers are taking a pay cut. I'm not sure this is necessarily a bad thing, if it avoids layoffs and reductions in service quality, instead spreading the pain around more thinly. But it does point to the possibility that this recession will indeed be different, and that it might mark the beginning of the end of sticky wages.( COULD BE. PROACTIVE FEAR OVERRIDING EVERYTHING ELSE )

There's been a huge shift in power in recent years from labor to capital: corporate profits have been rising much faster than wages for some time now ( DON'T TELL THAT TO PEOPLE WHO BELIEVE THAT ORGANIZED LABOR IS TOO POWERFUL ). It makes sense that capital would make use of its newfound power to reduce labor costs in a deflationary environment of rising unemployment. During the boom, companies laid off workers because those workers demanded, and cost, too much money. Now that workers have lost their negotiating leverage, we might start seeing more across-the-board pay cuts." ( COULD BE )

I would say that, in the case of FedEx, my understanding is that they are fighting for their life. In a possible bankruptcy situation, cutting wages is much easier. It might well be that in this current situation many businesses will end up near bankruptcy and that wage cuts could be higher than usual. It might also be that the fear and aversion to risk has effected workers to the point that lower wages in exchange for a job seems a good deal.

However, let me raise a few points:
1) Productivity is still rising
2) Worker's morale is not something you want to help depress in an already downbeat situation
3) As I pointed out in " I Don't Work In AIG Crap", workers who have made money for the company are not going to be happy taking a pay cut for other people's losses. It is possible that such treatment will lead them to look for another job, leading to the possible loss of the best employees of the business.

It might well turn out that wages aren't as sticky as they used to be, and it might also turn out to be a very bad thing for businesses and the economy, as well as the workers.

"The fact that we are having a recession while productivity is growing tells us a LOT about why we have a recession"

Casey Mulligan on Productivity:

"It looks like employment will be one percent lower in 2008Q4 than it was in 2008Q3. There is not much uncertainty about this, because October and November employment are already known.

Work hours per employee will also be lower -- maybe also about one percent. Thus, total work hours will be 1-2 percent lower, probably closer to 2 percent.

Productivity growth is the percentage change in GDP minus the percentage change in total work hours. I have seen forecasts that GDP 2008Q4 will be 1.25 percent lower than for 2008Q3. Thus, the forecasts imply further productivity GROWTH. Productivity also grew 2007Q4 through 2008Q3 (about 1.9 percent). The fact that we are having a recession while productivity is growing tells us a LOT about why we have a recession, and why it is so different from the 1981-82 recession or the Great Depression. More on this over the next week....

For those 136 million who still have jobs, productivity growth is VERY good news because productivity determines how much you ultimately get paid."

I tend to agree.

Thursday, November 6, 2008

"The rise in labor costs — while welcome to workers — was faster than the 2.8 percent pace economists were forecasting."

This figure always conflicts me, but we might as well digest it. From the NY Times:

"WASHINGTON (AP) — The efficiency of American workers slowed sharply in the summer as a huge pullback by consumers threw the national economy into reverse.
Skip to next paragraph
The New York Times

The Labor Department reported Thursday that productivity — the amount an employee produces for every hour on the job — grew at an annual pace of 1.1 percent in the third quarter, down from a 3.6 percent growth rate in the second quarter.

With productivity growth slowing, labor costs picked up. Unit labor costs — a measure of how much companies pay workers for every unit of output they produce — increased at a 3.6 percent pace in the third quarter, compared with a 0.1 percent rate of decline in the previous period.

Worker productivity growth slowed as overall production declined, reflecting the hit to consumers and the economy as a whole from the housing, credit and financial turmoil."