"The Year in Global Volatility
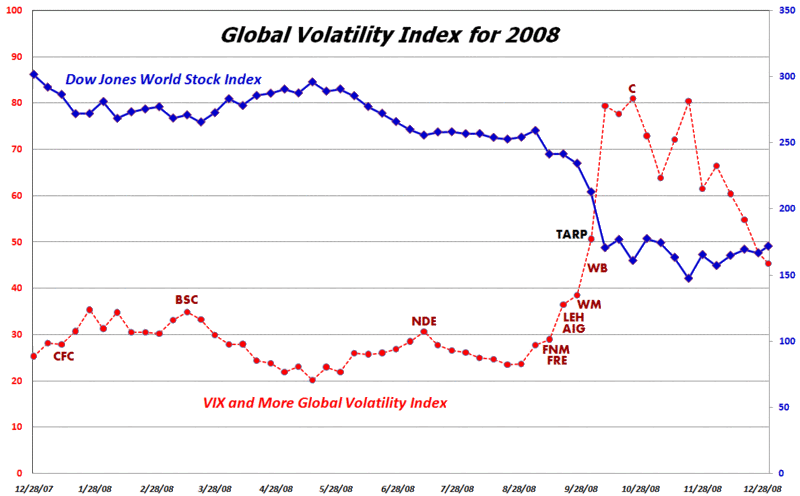
In November I launched the VIX and More Global Volatility Index, which is a weighted average of the implied volatility in options for equities in the 15 largest global economies. I will have more to say about the Global Volatility Index in 2009, but want to use this occasion to highlight the index as a means of tracking the rise of volatility in response to major volatility events during the course of the past year. In addition to the Global Volatility Index (shown in red), the chart below captures the Dow Jones World Stock Index (blue), as well as the signing of the TARP legislation (black) and the tickers (dark red) for some of the major financial companies that failed and/or were rescued by the U.S. government.

[source: VIX and More]
My own view has to do with Implicit and Explicit Government Guarantees. I say that my view looks pretty good. From Fannie/Freddie to Citi it has all been about government guarantees, which are needed to stop the Calling Run that began with Lehman. I'll chart the week to week developments sometime in the future. But one can see that, even though the Calling Run continues, the Volatility index has declined. I attribute this to the degree of confidence investors have in government intervention. It started to turn around from Lehman with the open-ended Citi bailout.


No comments:
Post a Comment