Tuesday, March 31, 2009

It is inadequate, but it also seems to be the most the administration can produce at this point.

From Free Exchange:

"Link exchange
Posted by:
Economist.com | WASHINGTON
Categories:
The econoblogosphere

TODAY’s recommended economics writing:

The discussion of Tim Geithner's banking plan continues. In today's Washington Post, Lucian Bebchuk, who responded to Hank Paulson's original asset purchase proposal by arguing for public-private funds bidding for assets at auction, says the Geithner plan is pretty good, but for one thing:

But while the program is intended to partner public and private capital, the partnership it sets up is quite unequal. As things stand, the private side -- the private manager and investors possibly affiliated with it -- would capture 50 percent of the upside but would bear a disproportionately small share of the downside, contributing as little as 8 percent of the fund's capital.

Treasury officials believe that because private parties have not thus far established funds dedicated to buying troubled assets, favorable terms are needed to induce their participation. This logic is reasonable, but it is important to keep the government subsidy at a minimum. Without any market check, the terms set by the government could substantially overshoot what is necessary to induce private participation and end up imposing large and unnecessary costs on taxpayers.

His solution? Have private investors bid on the share of the upside they're willing to accept in the partnership. He really likes auctions.

Meanwhile, Adam Posen has a very sobering look at the Geithner plan which, he says, duplicates many of the mistakes that Japanese leaders made before they were finally forced to get serious with the banking sector. It's not a pleasant read. But as Matt Yglesias notes, his is more an indictment of the American government as a whole—and by extension the American polity—than of the Geithner plan. It is inadequate, but it also seems to be the most the administration can produce at this point.

But some caveats are in order. The connexion between flailing banks and economic weakness isn't as clear as is often asserted. Some researchers have argued that Japanese household debt was the real source of the lost decade, which isn't encouraging for America but at least suggests a different policy tack. Mr Posen also notes that the Japanese economy began to take off in 2002, when it got serious about fixing the banks. But that also happens to be when Japan's recent export boom began. In any sample of two or three, significance will be difficult to obtain.

Deepening the sample to include two recent American experiences is James Surowiecki, in a very good column.

Elsewhere, Felix Salmon answers questions about the financial savviness of journalists.

Calculated Risk helpfully summarises March in charts.

And GM inspires confidence as only GM can."

Me:

Don the libertarian Democrat wrote:
April 1, 2009 4:46

"That is why the Geithner plan is so complex and jury-rigged, to avoid the need for public requests for more money for banks. Unfortunately, it is unlikely to succeed absent additional public money and more-intrusive government action. The plan will buy some time and certainly some appreciation in bank share prices. Current shareholders will be getting a new lease on life with subsidies from taxpayers. For that reason alone, the plan certainly will cost the taxpayer more in the end than a more direct recapitalization with public control would have."

It's complex and jury rigged because it's a Government/Private Hybrid Plan, that has to balance competing interests and incentives. TARP was bound to be that from the start. It is not simply the need to avoid asking for more funds from the Congress.

"In essence, the U.S. Treasury’s plan to subsidize private investors’ purchases of the banks’ toxic assets is a too-clever-by-half mechanism to fix the banks while avoiding going to Congress for more upfront on-budget expenditures. One can imagine the discussions at the White House: We have a budget to pass, and cannot give up those goals to give the bankers still more. Figure out some way to do this off-budget. And so the Geithner plan hugely bribes private investors with taxpayer money, as Simon Johnson, Paul Krugman, Jeffrey Sachs, and I have all described, with one-way government insured bets. Yet the bets are contingent, they only pay when the taxpayer loses—and those losses first appear on the Fed or FDIC balance sheet, not subject to congressional approval."

The government gave an incentive to hold these assets in hopes of government help when it saved AIG. In giving the banks money, it also gave them the resources to hold out for a higher price. Although the TAs have been selling, expecting government aid in this current crisis is a good bet. Because of these incentives and subsidies, buyers need to receive incentives and subsidies as well now. That's just part of the deal.

If you assume that everyone who is really involved in this knows that the government cannot really seize these large banks as of now, it becomes easier to see why this plan has worked out this way.

We are just buying time until we can actually seize these large banks, but, except for just letting the problem fester until then, we don't have much choice. I don't think that these auction ideas are of much help, because the investors who will buy these TAs know that they are going to need as CDS on future possible taxes, and so they know that there's a possible downside, even if they make money.

Here is a collection of 20 real estate and economic graphs for data released in March ...

TO BE NOTED: From Calculated Risk:

"March Economic Summary in Graphs

by CalculatedRisk on 3/31/2009 01:30:00 PM

Here is a collection of 20 real estate and economic graphs for data released in March ...

Click on graphs for larger image in new window.

********************

New Home Sales Monthly Not Seasonally Adjusted New Home Sales in February

The first graph shows monthly new home sales (NSA - Not Seasonally Adjusted).

Note the Red column for 2009. This is the lowest sales for February since the Census Bureau started tracking sales in 1963. (NSA, 27 thousand new homes were sold in February 2009; the previous low was 29 thousand in February 1982).

From: New Home Sales: Just above Record Low

********************

Total Housing Starts and Single Family Housing Starts Housing Starts in February

Total housing starts were at 583 thousand (SAAR) in February, well off the record low of 477 thousand in January (the lowest level since the Census Bureau began tracking housing starts in 1959).

Single-family starts were at 357 thousand in February; just above the record low in January (353 thousand).

Permits for single-family units increased in February to 373 thousand, suggesting single-family starts could increase in March.

From: Housing Starts Rebound

********************

Construction Spending Construction Spending in January

This graph shows private residential and nonresidential construction spending since 1993. Note: nominal dollars, not inflation adjusted.

Residential construction spending is still declining, and now nonresidential spending has peaked and will probably decline sharply over the next 18 months to two years.

From: Construction Spending: Non-Residential Cliff Diving

********************

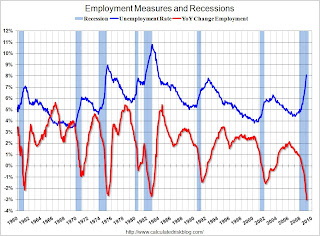
Employment Measures and Recessions February Employment Report

This graph shows the unemployment rate and the year over year change in employment vs. recessions.

Nonfarm payrolls decreased by 651,000 in February. The economy has lost almost 2.6 million jobs over the last 4 months!

The unemployment rate rose to 8.1 percent; the highest level since June 1983.

From: Employment Report: 651K Jobs Lost, 8.1% Unemployment Rate

********************

Year-over-year change in Retail Sales February Retail Sales

This graph shows the year-over-year change in nominal and real retail sales since 1993.

On a monthly basis, retail sales decreased slightly from January to February (seasonally adjusted), but sales are off 9.5% from February 2008 (retail and food services decreased 8.6%). Automobile and parts sales decline sharply 4.3% in February (compared to January), but excluding autos, all other sales climbed 0.7%.

From: Retail Sales: Some Possible Stabilization

********************

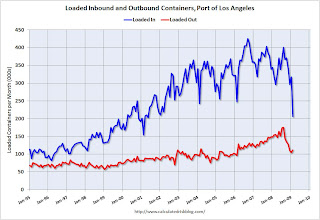
LA Area Port TrafficLA Port Traffic in February

This graph shows the loaded inbound and outbound traffic at the port of Los Angeles in TEUs (TEUs: 20-foot equivalent units or 20-foot-long cargo container). Although containers tell us nothing about value, container traffic does give us an idea of the volume of goods being exported and imported.

Inbound traffic was 35% below last February and 35% below last month.

From: LA Port Import Traffic Collapses in February

********************

U.S. Trade Deficit U.S. Imports and Exports Through January

This graph shows the monthly U.S. exports and imports in dollars through January 2009. The recent rapid decline in foreign trade continued in January. Note that a large portion of the decline in imports is related to the fall in oil prices - but not all.

The graph includes both goods and services. The import and export of services has held up pretty well; most of the collapse in trade has been in goods. Imports of goods has declined by one third from the peak of last July!

From: U.S. Trade: Exports and Imports Decline Sharply in January

********************

Capacity Utilization February Capacity Utilization

The Federal Reserve reported that industrial production fell 1.4% in February, and output in February was 11.2% below February 2008. The capacity utilization rate for total industry fell to 70.9%, matching the historical low set in December 1982.

This is a very sharp decline in industrial output.

From: Industrial Production and Capacity Utilization: Cliff Diving

********************

Residential NAHB Housing Market Index NAHB Builder Confidence Index in March

This graph shows the builder confidence index from the National Association of Home Builders (NAHB).

The housing market index (HMI) was flat at 9 in March (same as February). The record low was 8 set in January.

This is the fifth month in a row at either 8 or 9.

From: NAHB Housing Market Index Still Near Record Low

********************

AIA Architecture Billing Index Architecture Billings Index for February

"Following another historic low score in January, the Architecture Billings Index (ABI) was up two points in February. As a leading economic indicator of construction activity, the ABI reflects the approximate nine to twelve month lag time between architecture billings and construction spending. The American Institute of Architects (AIA) reported the February ABI rating was 35.3, up from the 33.3 mark in January, but still pointing to a general lack of demand for design services (any score above 50 indicates an increase in billings)."

From: Architecture Billings Index Near Record Low

********************

Vehicle Miles Driven Vehicle Miles driven in January

By this measure, vehicle miles driven are off 3.6% Year-over-year (YoY); the decline in miles driven is worse than during the early '70s and 1979-1980 oil crisis.

As the DOT noted, miles driven in January 2009 were 3.1% less than January 2008.

From: DOT: U.S. Vehicle Miles Off 3.1% in January

********************

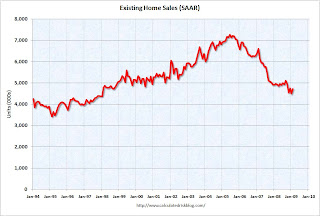
Existing Home Sales Existing Home Sales in February

This graph shows existing home sales, on a Seasonally Adjusted Annual Rate (SAAR) basis since 1993.

Sales in February 2009 (4.72 million SAAR) were 5.1% higher than last month, and were 4.6% lower than January 2008 (4.95 million SAAR).

It's important to note that about 45% of these sales were foreclosure resales or short sales. Although these are real transactions, this means activity (ex-distressed sales) is under 3 million units SAAR.

From: Existing Home Sales Increase Slightly in February

********************

Existing Home Inventory Existing Home Inventory February

This graph shows nationwide inventory for existing homes. According to the NAR, inventory increased to 3.8 million in February. The all time record was 4.57 million homes for sale in July 2008. This is not seasonally adjusted.

Usually most REOs (bank owned properties) are included in the inventory because they are listed - but not all. Recently there have been stories about a substantial number of unlisted REOs - this is possible, but not confirmed.

From: Existing Home Sales Increase Slightly in February

********************

Case-Shiller House Prices Indices Case Shiller House Prices for January

This graph shows the nominal Composite 10 and Composite 20 indices (the Composite 20 was started in January 2000).

The Composite 10 index is off 30.2% from the peak, and off 2.5% in January.

The Composite 20 index is off 29.1% from the peak, and off 2.8% in January.

From: Case-Shiller: Prices Fall Sharply in January

********************

Kennedy Greenspan Mortgage Equity Withdrawal Mortgage Equity Extraction for Q4

Here are the Kennedy-Greenspan estimates (NSA - not seasonally adjusted) of home equity extraction for Q4 2008, provided by Jim Kennedy based on the mortgage system presented in "Estimates of Home Mortgage Originations, Repayments, and Debt On One-to-Four-Family Residences," Alan Greenspan and James Kennedy, Federal Reserve Board FEDS working paper no. 2005-41.

For Q4 2008, Dr. Kennedy has calculated Net Equity Extraction as minus $77 billion, or negative 2.9% of Disposable Personal Income (DPI).

This graph shows the net equity extraction, or mortgage equity withdrawal (MEW), results, both in billions of dollars quarterly (not annual rate), and as a percent of personal disposable income.

From: Q4 Mortgage Equity Extraction Strongly Negative

********************

Weekly Unemployment Claims Unemployment Claims

The first graph shows weekly claims and continued claims since 1971.

The four week moving average is at 649,000.

Continued claims are now at 5.56 million - the all time record.

From: Unemployment Insurance: Continued Claims Over 5.5 Million

********************

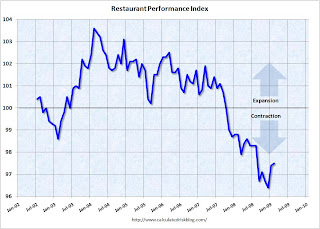
Restaurant Performance Index Restaurant Performance Index for February

"Restaurant industry performance remained soft in February, as the National Restaurant Association’s comprehensive index of restaurant activity stood below 100 for the 16th consecutive month. The Association’s Restaurant Performance Index (RPI) ... stood at 97.5 in February, up 0.1 percent from its January level."

From: Restaurant Peformance Index: 16th Consecutive Month of Contraction

********************

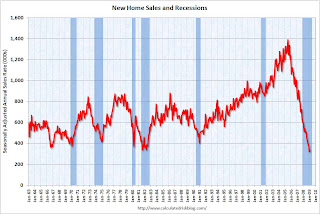
New Home Sales and Recessions New Home Sales: February

This graph shows New Home Sales vs. recessions for the last 45 years. New Home sales have fallen off a cliff.
Sales of new one-family houses in February 2009 were at a seasonally adjusted annual rate of 337,000, according to estimates released jointly today by the U.S. Census Bureau and the Department of Housing and Urban Development.

This is 4.7 percent (±18.3%) above the revised January rate of 322,000, but is 41.1 percent (±7.9%) below the February 2008 estimate of 572,000.
From: New Home Sales: Just above Record Low

********************

Philly Fed State Conincident Map Philly Fed State Indexes February

Here is a map of the three month change in the Philly Fed state coincident indicators. All 50 states are showing declining activity.

This is the new definition of "Red states".

This is what a widespread recession looks like based on the Philly Fed states indexes.

From: Philly Fed State Indexes: We're all Red States now!

********************

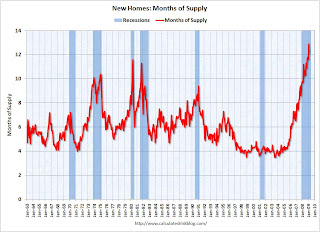
New Home Months of Supply and Recessions New Home Months of Supply: February

There were 12.2 months of supply in February - just below the all time record of 12.9 months of supply set in January.
The seasonally adjusted estimate of new houses for sale at the end of February was 330,000. This represents a supply of 12.2 months at the current sales rate.
From: New Home Sales: Just above Record Low

that a 47 percent increase year-over-year seems to suggest that overall delinquencies are increasing; but by how much is anyone’s guess

TO BE NOTED: From HousingWire:

Defaults on privately insured U.S. mortgages fell nearly 16 percent in February from the month before, but were up 47 percent from one year ago — and figuring out what that really means is next to impossible, given the data.

That’s the key takeaway from [1] data released Tuesday morning by the Mortgage Insurance Companies of America, or MICA, which said that 89,722 insured borrowers were 60 or more days in arrears at the end of February, compared to 60,911 one year earlier. February’s totals were well below the 106,484 defaults recorded in January, the highest level recorded by the MI trade group.

But making sense of the delinquency data? Good luck. In April 2008, MICA said it saw a sharp increase in reported defaults after a large lender changed how it reported delinquency statistics — the group never identified the lender, largely believed to be Countrywide, nor has the group specified the impact of the reporting change on prior numbers.

In July 2008, Triad Guaranty Corp. [{TGIC]] quit reporting its statistics to MICA after the company went into portfolio run-off, and in December 2008, Radian Group Inc. ([2] RDN: 1.82 +17.42%) — which had not earlier participated in shared reporting of data to MICA — began reporting data on its operations.

Which means, in a nutshell, that a 47 percent increase year-over-year seems to suggest that overall delinquencies are increasing; but by how much is anyone’s guess, given reporting changes, additions and losses of reporting entities that all have had a material impact upon reported statistics.

Feburary’s cure rate — the number of delinquent loans modified or otherwise put into a workout plan — was 75.5 percent, up sharply from 48 percent in January 2009, but slightly below the 78.7 rate booked in February 2008.

Demand for new mortgage insurance fell slightly between January and Febuary, from 76,130 applications received to 73,109. That total is well below the 152,786 applications received one year earlier. Despite declining applications, primary insurance in force remained mostly flat in Febuary, MICA said.

Write to Paul Jackson at [3] paul.jackson@housingwire.com."

implementing the net-liberty-enhancing policies that a real libertarian would favor if he or she were truly a decisive agent

TO BE NOTED: From Marginal Revolution:

"
Words of wisdom

From Matt Yglesias:

The question here is what would Adam Posen have done if he had Tim Geithner’s job? And based on Posen’s analysis, I think the only conclusion you can reach is that he’d have done more-or-less the same thing. Talking about a different issue last week, I heard Tyler Cowen forcefully make the point that you have to think of the political constraints as a real policy consideration. Suppose Geithner had asked Congress to appropriate $1 trillion to implement a program of bank nationalization, asset writedowns, and loan guarantees—what would that have accomplished? It certainly wouldn’t have gotten Congress to appropriate $1 trillion to implement a program of bank nationalization, asset writedowns, and loan guarantees. It might have derailed the budget and thrown the political momentum on the Hill to proponents of a neo-Hooverite spending freeze program. It might have caused panic. And it certainly would have undermined the credibility of the inevitable effort by Geithner to do the most he can with the authority he already has.

One thing I like about Bryan Caplan's book is an interpretation which he will probably hate. The truly decisive actors are people directly in the political process. Maybe the "libertarians" who are or have been in politics are not just "sell outs." Rather they are implementing the net-liberty-enhancing policies that a real libertarian would favor if he or she were truly a decisive agent.

Posted by Tyler Cowen"

aimed at reducing the losses banks have been forced to report as the values of their mortgage-backed securities have crumbled

TO BE NOTED: From the NY Times:

"
Banks Are Set to Receive More Leeway on Asset Values

Under intense political pressure, the board that sets accounting rules in the United States will meet on Thursday to complete changes in accounting rules that are aimed at reducing the losses banks have been forced to report as the values of their mortgage-backed securities have crumbled.

The changes, proposed two weeks ago after a Congressional hearing in which Robert H. Herz, the chairman of the Financial Accounting Standards Board, was essentially ordered to change the rules or face Congressional action, are generally supported by banks, although some want the board to go even further.

But they have produced a strong reaction from some investors, with one investor group complaining that the changes would “effectively gut the transparent application of fair value measurement.” The group also says changes would delay the recovery of the banking system.

“Investors,” wrote Kurt N. Schacht, the managing director of the Centre for Financial Market Integrity of the CFA Institute, “will not be willing to commit capital to firms that hide the economic value of their assets and liabilities.”

It seems highly unlikely that FASB will make major changes to the proposals that it rushed out only two weeks ago, but it may be willing to consider additional steps. And it will have to face the important decision of when to make the new rule take effect.

Some banks have requested that the board issue further guidance to make it easier for them to avoid writing down the value of assets, while some investors have asked for detailed disclosures to help them assess how far the newly reported values are from current market value.

The world of accounting rulemaking is normally a staid and slow moving one, with the board offering detailed rationales for changes and giving interested parties months to comment on them. Most comment letters come from people well versed in the accounting literature, arguing points that can seem arcane even if they could have a major impact on financial reports.

The process this time has been different in almost every respect. The board allowed only 15 days for comments, and said it would act after taking just a day to review the comments.

Those comments arrived by the hundreds, including bitter reactions from investors. “Market value is market value. Stop letting the financial industry call a duck a whale,” stated an e-mail message signed by Diane Walser.

“Who will benefit?” asked Roy Bell. “Only the very ones who already broke all the rules and have brought destruction to the world as we know it.”

The file also includes letters, evidently solicited by banking organizations, from groups contending that relaxing the rules would allow banks to report higher profits and make more loans.

The Georgia Affordable Housing Coalition submitted such a comment, perhaps without carefully reading it. The opening paragraph states, “This letter sets forth the comments of [insert name of organization here] regarding these proposals.”

The proposed rule interpretations deal with two issues in asset valuation. Banks are required to show some assets at market value, and report profits or losses based on changes in that value. Other assets may be reported at original cost, but if their value deteriorates they must be written down to market value if there is an “other than temporary impairment” in value.

The banks argue that current market values are unreasonably low, reflecting distressed trading, and are producing values that are well below the amount that will eventually be realized.

One change would allow banks much more room to conclude that inactive markets are distressed, allowing them to value the assets at what they believe they would be worth in a normal market. The other change would let banks avoid reporting some of the impairment losses on their income statements.

Some financial institutions want immediate action. The Association of Corporate Credit Unions asked the board to make the change retroactive, so that 2008 annual reports could be restated. Whatever the details of the proposal adopted Thursday, it represents an abrupt turnabout for the board. Only a day before the Congressional hearing on March 12, Mr. Herz gave an interview in which he disparaged what he called “mark to management” accounting. But after the Congressional grilling, the board quickly moved to make it much easier for banks to value assets at what they should be worth, rather than what they were currently selling for.

The CFA Institute reacted bitterly to that about-face. “Continuing on the path of politicized accounting standard-setting that caters to special interests,” it wrote, would make it hard for the board “to maintain its credibility.”

In some ways, the reversal is similar to one that the board made more than a decade ago, when it backed down under Congressional pressure from a rule requiring that companies report the value of stock options as an expense. That rule was revived only after corporate scandals early in this decade.

If the board does adopt the changes, they may quickly become universal. The International Accounting Standards Board, which sets rules for many countries, itself hurriedly changed an aspect of its market-value rule under pressure from the president of France."

Unless the Legacy Loan Program winds up buying assets at $90 or more, banks won't sell.

TO BE NOTED: From Accrued Interest:

"PPIP: Maybe you'd like it back in your cell?

The big question surrounding the toxic asset plan is will banks sell? I've put a little pencil to paper here and come up with some actual numbers.

First of all, I expect the Legacy Securities Program will work wonderfully. Sellers will flock to it like Jawas to a stray astromech droid. This program is aimed at securities which have been severely impaired from both a credit and liquidity perspective. CLOs, RMBS, ABS, CMBS, etc. The program should succeed in turning these programs into just liquidity impaired. In effect, it will separate the red ones with the bad motivators from the blue ones in prime condition. That will be key to an eventual economic recovery. It should foster a healthy new issue market for RMBS, ABS and CMBS (don't know that CLOs can come back), which will help get the velocity of money back to a more normal level.

Obviously having ready buyers able to earn impressive ROEs should improve the value of the underlying assets. Financial institutions have already marked these securities to market, an improvement in the actual value of the instruments ought to result in an improvement of balance sheets. This will particularly benefit financials who invested primarily at the top of the asset-backed capital structure. It will also benefit those that hold more risk in securities (such as brokerages Goldman Sachs and Morgan Stanley and possibly some P&C insurers) and less those that hold risk in loans (such as almost all banks). Even there, much of Goldman and Morgan's risks are tied to the equity markets, not to debt markets. Same goes for life insurance, generally speaking.

That brings us to the with the Treasury's Legacy Loan Program. I expect this to go over like the exotic twi'lek dancer's routine in Jabba's palace. The plan will indeed increase the theoretical price at which banks could sell loans. That's fine, but its short help. Loans haven't been marked to market. Instead, they are held at book value less an allowance for expected loss.

I've done some deep dives on bank residential loan portfolios. Getting detailed data is a challenge, but basically I tried to figure out what percentage of the bank's current portfolio is "challenged." High CLTV, bad geographics, low FICO, etc. You can make a relatively safe assumption that most of the loss reserve is pledged to those kinds of loans. Anyway, I can't find any big banks that are holding, say home equity loans at less than 90% of face. Unless the Legacy Loan Program winds up buying assets at $90 or more, banks won't sell.

So will the PPIF's pay $90? I doubt it. Take home equity loans as an example. Start with the following assumptions:

  • PPIFs get loans at 1mo-LIBOR +50bps. Its hard to say exactly what the cost of funds might be, but worth noting that FDIC paper trades around L+20.
  • 6-1 leverage, which is the max allowed under the program. I think its reasonable that non-delinquent, prime loans would get the max leverage.
  • Assume the loans float at Prime-flat.
  • Assume the loans are 1-2 years old, and will repay over the course of 6 years. To make it easy I'm going to assume equal payments per month.
  • The pool of loans will suffer 10% cumulative losses, all of which occur in the first two years. I won't write down the losses as they occur, simply take away the interest. That's consistent with a hold-to-maturity IRR calculation.
  • Finally, and perhaps most importantly, I'm assuming that the PPIF equity investors are targeting an IRR of 20%.
The result? $82.5.

That price will render it impossible for most banks to sell. For example, based on Bank of America's recent earnings presentation, it has something like $250 billion of prime, non-delinquent home equity loans with 90%+ LTV. I'd call this the kind of stuff that isn't exactly toxic, but selling could improve BAC's risk exposure significantly. Say they effectively have a $90 mark on these. If they sell at $82, they'd suffer an 8% loss versus their capital, or $20 billion. BAC has core equity capital of $48 billion. You do the math.

I don't expect commercial loans to be much better. Now a lot of commercial stuff has large loan loss reserves, and therefore sales would more easily be accretive to capital. But commercial loans are also present an information asymmetry problem. You can put a zillion residential loans into a pool and get some semblance of diversification. You can then look at average stats and get some idea of the make-up of the loans: geo diversification, average FICO, etc. A bank that is selling a commercial loan is telling you they don't want that commercial loan anymore.

This isn't to say the toxic asset plan will have no positive impact, but it is likely to be more indirect than investors are currently hoping. The best chance banks have for decreasing their residential loan portfolios is a revived securitization market, which is the primary aim of the TALF. Banks may be more willing to sell a portion of their home equity loans as a senior security, with the bank retaining a subordinate position. In that case, the bank might retain the upside while still freeing up some capital. In addition, a revived securitization market would give the market confidence that banks have enough liquidity to hold their loan portfolios to maturity.

It will also help banks who have made larger writedowns, especially those that made acquisitions. At the time of acquisition, the bank has to write down the loan to fair market value. In the case of J.P. Morgan's acquisition of WaMu, or Wells Fargo's acquisition of Wachovia, there would be no motivation to under-estimate the FMV decline. Those banks could therefore enjoy improved capital positions from certain sales. "

Note to Treasury Secretary Geithner and his team… you could encourage the TARP banks to use this platform to list mortgage securities…

TO BE NOTED: From Shopyield:

"
Trading platform transparency

There are many alternative trading systems (ATS) in the fixed income markets… they have slightly different price discovery, quotation and trade reporting structures… think of them as “liquidity pools”…

I’ve always thought the important thing for market transparency and fairness is that all investors have access to all bids and offers on an ATS (think of eBay’s structure)… this is also how exchanges work… (instead of this structure most fixed income platforms are “request for quote” (RFQ) where a buyside firm puts out a request for bids or offers from dealers… generally other investors don’t see the RFQs… so the ATS are most often dealer controlled markets… I wonder what academic studies are available on this topic?)

Broadridge, which spun off from ADP, announced a new alliance to create access to less liquid mortgage and other bonds… the platform allows equel access to all users (sellside and buyside)…

Note to Treasury Secretary Geithner and his team… you could encourage the TARP banks to use this platform to list mortgage securities… here is what the platform can handle (article follows from Wall Street and Tech):

Trade Discovery ™

• Agency Pools
• Agency CMOs
• Trust IOs / POs

~~~~ Broadridge, Beacon To Help Clients Find Fixed-Income Liquidity

Trading clients allowed to pore over daily fixed-income securities transaction records.
By Penny Crosman
March 31, 2009

Broadridge, a provider of technology-based outsourcing solutions to the financial services industry, and Beacon Capital Strategies, which operates a marketplace dedicated to providing liquidity and electronic trading in the less-liquid fixed-income market, today announced a multi-year strategic alliance. The alliance is meant to help the firms serve their clients who actively trade less-liquid fixed-income securities including agency mortgage-backed securities, asset-backed securities, and collateralized mortgage obligations.

Broadridge is a fixed-income securities processing provider that currently handles on average more than $3 trillion in notional value of U.S. fixed-income securities transactions daily. Beacon established the first trading platform tailored to he less-liquid fixed-income market, which is open to all participants on an anonymous and equal basis. This alliance will help the firms’ clients locate difficult-to-find securities in the less-liquid fixed-income segment, thereby enhancing liquidity and efficiency to the overall marketplace.

By using Broadridge’s impact and MBS Expert products and Beacon’s Trade Discovery platform, clients will be able to search through less-liquid fixed-income securities, find the other side of the trade for instruments that meet specific investment criteria, and transact on liquidity that otherwise would not be publicly advertised in current trading channels.”~~~~

“My forecast is actually for some improvement beginning around the middle of the year,”

TO BE NOTED: From Real Time Economics:

"
By Brian Blackstone

The U.S. economy should find its footing around the middle of the year even after another “significant” contraction in the first quarter, Federal Reserve Bank of Minneapolis President Gary Stern said Tuesday.

Still he warned in an interview with The Wall Street Journal and Dow Jones Newswires that, when the recovery does come, it will be hard to discern right away.

“My forecast is actually for some improvement beginning around the middle of the year,” Stern said. “That doesn’t mean we’re going to take off to exceedingly rapid growth.”

But the inevitable worries about double-dip recession won’t get a very receptive response from Stern, who is in his third recession since becoming head of the Minneapolis Fed 24 years ago. His tenure, the longest of any current Fed official, spans the chairmanships of Paul Volcker, Alan Greenspan and Ben Bernanke.

“One of the things I’ve observed coming out of the last two recessions is that there’s always a lot of concern about (how) ‘this is a very fragile recovery’” and worries that “if the Fed doesn’t do just the right thing…the whole thing will collapse again,” he said, leading to talk of “double dips, triple dips.”

Stern knows from experience how hard it is to spot the trough of a business cycle. Recalling his days as the Minneapolis Fed’s research director in 1982, he said that he told the Minneapolis Fed’s directors that there was “no sign of the recession ending” in November of that year. Of course, the National Bureau of Economic Research eventually determined that the recession did in fact end that
same month.

Even if his recession-dating record isn’t spotless, Stern knows his history, and “if you look at history I don’t know if we’ve ever had a double dip,” with the possible exception of 1980 and 1982, he said.

Still, Stern expects the employment market to play out this time much as it did coming out of the last two recessions in 1991 and 2001, with job growth slow to catch up to rising output.

Stern disputes comparisons between the current economic downturn and the Great Depression.

To be sure, “these are in my judgment historic times in the financial sector,” Stern said. Noting that there used to be five major, standalone investment banks in the U.S., Stern said, “if you had told me 13 months ago we were going to have zero at the end of March, I’d have said no way.”

On the other hand, “I wouldn’t rush to the Depression when it comes to the economy for comparisons,” Stern said.

“For those of us who were around for ‘80-’82 and ‘73-’75, what’s happening in the economy and a lot of the rhetoric that goes with it rings more familiar,” he said.

Stern also said that he sees some signs that credit market conditions have improved since late last year, though the gains are of the uneven “two steps forward, one step back” variety."

looks upon the conditions of that mode of production as self-evident laws of Nature

TO BE NOTED: From Understanding Society:

"Primitive accumulation


Marx's treatment of the "so-called 'primitive accumulation'" is one of the most historically detailed sections in Capital: A Critique of Political Economy (Volume 1). And it is one of the most interesting parts of Capital to read as a separate piece. (Here is an electronic text of the section.) It is Marx's account of the historical processes of change in rural life of the fifteenth through eighteenth century in Britain and Ireland, through which peasants were forced off their land and the commons were enclosed. Marx believes that this separation of the peasantry from the land was a necessary condition for the development of capitalism, in that it created the conditions in which there was a pliable and abundant proletariat. This "free" proletariat was needed for the creation of the factory system and the development of manufacturing cities. So the process of primitive accumulation created the changes in social relations, property relations, and the accumulation of wealth that permitted the creation of the capital-labor relation and factory-based capitalism.

Marx sometimes puts this point in a fairly teleological way, looking at primitive accumulation as a necessary step on the road to British capitalism. (For example, he refers to this process as "the revolution that laid the foundation of the capitalist mode of production.") But it is possible, and preferable, to read Marx's analysis here less teleologically, as simply a detailed account of some of the crucial but contingent changes that took place in rural social relations during these centuries, without importing the idea that these changes were functionally related to the later development of capitalism. And read non-teleologically, the section holds up fairly well in relation to modern historical scholarship.

Marx describes the basic social relations of British rural life in the fifteenth century in these terms, as a freeholding peasantry with access to substantial common lands, pasture, and forest:

The immense majority of the population consisted then, and to a still larger extent, in the 15th century, of free peasant proprietors, whatever was the feudal title under which their right of property was hidden. In the larger seignorial domains, the old bailiff, himself a serf, was displaced by the free farmer. The wage-labourers of agriculture consisted partly of peasants, who utilised their leisure time by working on the large estates, partly of an independent special class of wage-labourers, relatively and absolutely few in numbers. The latter also were practically at the same time peasant farmers, since, besides their wages, they had allotted to them arable land to the extent of 4 or more acres, together with their cottages. Besides they, with the rest of the peasants, enjoyed the usufruct of the common land, which gave pasture to their cattle, furnished them with timber, fire-wood, turf, &c.
And he identifies the crucial turn towards expropriation of the free peasant proprietor:
In insolent conflict with king and parliament, the great feudal lords created an incomparably larger proletariat by the forcible driving of the peasantry from the land, to which the latter had the same feudal right as the lord himself, and by the usurpation of the common lands. The rapid rise of the Flemish wool manufactures, and the corresponding rise in the price of wool in England, gave the direct impulse to these evictions. The old nobility had been devoured by the great feudal wars. The new nobility was the child of its time, for which money was the power of all powers. Transformation of arable land into sheep-walks was, therefore, its cry.
(It is interesting to recall that Oliver Goldsmith describes the eighteenth-century version of this process in Ireland in his poem, The Deserted Village (1770):
Sweet smiling village, loveliest of the lawn,
Thy sports are fled, and all thy charms withdrawn;
Amidst thy bowers the tyrant's hand is seen,
And Desolation saddens all thy green:
One only master grasps the whole domain,
And half a tillage stints thy smiling plain.
No more thy glassy brook reflects the day,
But, choked with sedges, works its weedy way;
Along thy glades, a solitary guest,
The hollow-sounding bittern guards its nest;
Amidst thy desert walks the lapwing flies,
And tires their echoes with unvaried cries:
Sunk are thy bowers in shapeless ruin all,
And the long grass o'ertops the mouldering wall
And, trembling, shrinking from the spoiler's hand,
Far, far away thy children leave the land.

Ill fares the land, to hastening ills a prey,
Where wealth accumulates, and men decay.
Princes and lords may flourish, or may fade;
A breath can make them, as a breath has made:
But a bold peasantry, their country's pride,
When once destroy'd, can never be supplied. )
And Marx emphasizes the coercive nature of this expropriation of the yeoman peasant:
Even in the last decade of the 17th century, the yeomanry, the class of independent peasants, were more numerous than the class of farmers. They had formed the backbone of Cromwell’s strength, and, even according to the confession of Macaulay, stood in favourable contrast to the drunken squires and to their servants, the country clergy, who had to marry their masters’ cast-off mistresses. About 1750, the yeomanry had disappeared, and so had, in the last decade of the 18th century, the last trace of the common land of the agricultural labourer. We leave on one side here the purely economic causes of the agricultural revolution. We deal only with the forcible means employed.
A crucial component of the "primitive accumulation", in Marx's interpretation, was the abolition of common property, culminating in the enclosure acts in the seventeenth century:
Communal property — always distinct from the State property just dealt with — was an old Teutonic institution which lived on under cover of feudalism. We have seen how the forcible usurpation of this, generally accompanied by the turning of arable into pasture land, begins at the end of the 15th and extends into the 16th century. But, at that time, the process was carried on by means of individual acts of violence against which legislation, for a hundred and fifty years, fought in vain. The advance made by the 18th century shows itself in this, that the law itself becomes now the instrument of the theft of the people’s land, although the large farmers make use of their little independent methods as well. The parliamentary form of the robbery is that of Acts for enclosures of Commons, in other words, decrees by which the landlords grant themselves the people’s land as private property, decrees of expropriation of the people. Sir F. M. Eden refutes his own crafty special pleading, in which he tries to represent communal property as the private property of the great landlords who have taken the place of the feudal lords, when he, himself, demands a “general Act of Parliament for the enclosure of Commons” (admitting thereby that a parliamentary coup d’état is necessary for its transformation into private property), and moreover calls on the legislature for the indemnification for the expropriated poor.
We even are afforded a glimpse of the economist's view of the rationality of enclosure. According to John Arbuthnot, enclosure and the creation of private farms is a more productive use of land and labor:
Let us hear for a moment a defender of enclosures and an opponent of Dr. Price. “Not is it a consequence that there must be depopulation, because men are not seen wasting their labour in the open field.... If, by converting the little farmers into a body of men who must work for others, more labour is produced, it is an advantage which the nation” (to which, of course, the “converted” ones do not belong) “should wish for ... the produce being greater when their joint labours are employed on one farm, there will be a surplus for manufactures, and by this means manufactures, one of the mines of the nation, will increase, in proportion to the quantity of corn produced.”
And here Marx describes the final stages of the "rationalization" of agriculture, in the expropriation of the Scots:
The last process of wholesale expropriation of the agricultural population from the soil is, finally, the so-called clearing of estates, i.e., the sweeping men off them. All the English methods hitherto considered culminated in “clearing.” As we saw in the picture of modern conditions given in a former chapter, where there are no more independent peasants to get rid of, the “clearing” of cottages begins; so that the agricultural labourers do not find on the soil cultivated by them even the spot necessary for their own housing. But what “clearing of estates” really and properly signifies, we learn only in the promised land of modern romance, the Highlands of Scotland. There the process is distinguished by its systematic character, by the magnitude of the scale on which it is carried out at one blow (in Ireland landlords have gone to the length of sweeping away several villages at once; in Scotland areas as large as German principalities are dealt with), finally by the peculiar form of property, under which the embezzled lands were held.
Eventually we come to the point where industrial capitalism is feasible and there is a "free" proletariat available for labor:
It is not enough that the conditions of labour are concentrated in a mass, in the shape of capital, at the one pole of society, while at the other are grouped masses of men, who have nothing to sell but their labour-power. Neither is it enough that they are compelled to sell it voluntarily. The advance of capitalist production develops a working-class, which by education, tradition, habit, looks upon the conditions of that mode of production as self-evident laws of Nature. The organisation of the capitalist process of production, once fully developed, breaks down all resistance.
And, of course, Engels picks up the story from the perspective of nineteenth-century Manchester and Birmingham, and the conditions of squalor and oppressive factory labor that resulted. (See an earlier posting on Engels's sociology of the proletarian city.)

The English Marxist historians have devoted a lot of their attention to this period of British social history. (Harvey Kaye gives a very good account of the work of this generation of Marxist historians in The British Marxist Historians.) Maurice Dobb is one of the English socialist historians who has retraced Marx's steps on this subject in some detail. One of Dobb's important books, Studies In The Development Of Capitalism (1963), treats this process of the decline of the English peasantry and the rise of the proletariat, making use of the historical scholarship of the first part of the twentieth century. Some of Rodney Hilton's research on this period can be found in Class Conflict and the Crisis of Feudalism: Essays in Medieval Social History (Rev). Several generations later, Robert Brenner gave a somewhat different interpretation of the history of agrarian change in England from the sixteenth to the eighteenth centuries; his views were developed in the splendid journal Past & Present and were separately published along with a round of critical reactions in The Brenner Debate: Agrarian Class Structure and Economic Development in Pre-industrial Europe.

so bids well above current market prices for these assets by the PPIFs or through the TALF seem unlikely

TO BE NOTED: From Morgan Stanley via Zero Hedge:

"United States
Review and Preview
March 31, 2009

By Ted Wieseman | New York

With all the big announcements about the Treasury’s legacy asset and loan purchase plans and strong rallies seen in most risk markets in response, as well as some better-than-expected economic data, Treasury and other interest rate markets had a surprisingly quiet week that was mostly focused on supply and left Treasury yields mixed. In addition to largely ignoring the surge in stocks and rallies to varying extents in other key markets in response to the Treasury plan – with a very strong rally by the commercial mortgage CMBX market versus a comparatively soft response by the subprime ABX market particularly interesting – Treasuries also paid almost no attention to a round of overall better-than-expected data, probably partly because investors were looking ahead to what’s expected to be a rough run of more important early figures for March in the coming week’s employment, ISM and motor vehicle sales results. The data were also a good bit better on a headline basis in a number of cases than in some of the important underlying details. New and existing home sales both posted rebounds off their lows in February but showed little progress in working down the severely bloated inventory situation heading into the key spring selling season. Both overall and core durable goods orders posted good gains in February but only after extremely large downwardly revised declines in January. Even with a slight recovery in February, capital goods shipments were so weak in the revised January numbers that the outlook for 1Q investment continued to worsen. Fourth quarter GDP growth was revised down less than expected to -6.3% from -6.2% but partly because of a smaller downward adjustment to inventories that pointed to a partly offsetting larger inventory drag in 1Q. Even with a stronger path for 1Q consumption implied by the personal income report, we cut our 1Q GDP estimate to -5.1% from -4.9%. Instead of trading on the Treasury plans, other markets’ reactions to the plans or the economic news, supply was the overriding market focus in what activity there was during the week’s sluggish trading, and this cuts two ways. The Fed’s surprise announcement that it would be including long bonds in its initial round of Treasury purchases after previously saying buying would be focused in the 2-year to 10-year range helped the long end outperform on the week. And the very rapid start to the buying program provided additional support. As heavy as the Fed’s US$15 billion in purchases was, it was only a fraction of the record US$98 billion of new coupon supply in 2s, 5s and 7s during the week. After a solid start to the three auctions with Tuesday’s 2-year, the week’s Treasury market lows were hit after a poor 5-year sale Wednesday that added to supply jitters from the failed UK gilt auction. Once the much better 7-year auction wrapped up the supply on Thursday, however, and the market was able to look ahead to a busy schedule of Fed buying combined with a week-and-a-half break in new issuance, the market was able to rebound to close the week Thursday and Friday.

For the week, benchmark Treasury yield moves ranged from modest gains driven by the Fed’s surprise announcement to decent losses in the intermediate part of the curve led by the 7-year, which reversed much of its strong outperformance in initial response to the FOMC’s Treasury buying announcement. The old 2-year yield was flat at 0.86%, 3-year up 4bp to 1.26%, old 5-year up 12bp to 1.76%, old 7-year up 15bp to 2.31%, 10-year up 13bp to 2.76% and 30-year down 6bp to 3.62% (for the new issues, there was about a 4bp yield pick-up for the 2-year and 5-year and 6bp for the 7-year). Even with risk markets surging, demand for cash reached new extremes, though this may have mostly just reflected quarter-end book-squaring. Very short-dated bills closed negative Thursday before reversing course slightly on Friday to leave the 4-week bill’s yield down 7bp to 0.01%. For the week, commodity prices weren’t much changed, with only small further upside in oil prices in particular, but TIPS performed extremely well even after a partial pullback to extend what’s now been a three-week run of major outperformance. The 5-year TIPS yield fell 13bp to 0.82%, 10-year 4bp to 1.34% and 20-year 14bp to 1.92%. Current coupon 4% mortgages ended the week about unchanged (and with little day-to-day volatility) to outperform the sell-off in the intermediate part of the Treasury curve (though performance was notably worse on an option-adjusted spread basis as interest rate volatility declined). This left yields on 4% MBS a bit above 3.9%, down from near 4.15% two weeks ago and the year’s highs above 4.3% at the end of February. Mortgage rates being offered to consumers have tracked the rally in the MBS market, falling to record lows in the latest week.

Fed Treasury buying got off to a fast start, with two US$7.5 billion purchases, the first in the 7-year to 10-year range and the second 2-year to 3-year. Interestingly, by far the biggest purchase in the former was of the on-the-run 7-year issue and almost all of the buying in the latter was in the current 3-year. The Fed always stayed away from buying benchmark issues in the past as it expanded its Treasury portfolio gradually over the years (until reversing course after mid-2007 when it began selling down a large portion of its Treasury holdings as it was initially sterilizing its other liquidity facilities). But the goal now is clearly to lower broader borrowing costs as effectively as possible, not to gradually expand the Fed’s balance sheet in a non-market disruptive way in the manner of previous historical coupon passes, and these first two operations certainly suggest that the Fed quite reasonably thinks that largely focusing on supporting yields on the benchmark issues is the best way to do this. There will be three more rounds of Fed buying in the coming week – August 2026 to February 2039 maturities Monday; May 2012 to August 2013 Wednesday; and September 2013 to February 2016 Thursday. This additional buying will come during an off week for new Treasury coupon supply before 10-year TIPS, 3-year and 10-year auctions the week of April 6. On top of the fast start to the Treasury buying, the Fed’s net purchases of MBS of US$33 billion in the most recent week were also a new high, though the past week’s agency purchase (agency purchases are expected to take place generally once a week going forward under updated guidelines released by the New York Fed) of US$2.7 billion was around the average size seen up to this point. A continued pick-up in the pace of mortgage purchases may be needed in the weeks ahead as refinancings are likely to ramp up very sharply and put substantial supply pressures on the mortgage market.

The announcement of the Treasury’s legacy asset and loan purchase plans helped risk markets generally extend or resume significant rebounds that in most cases started off lows hit March 9. The S&P 500 gained another 6% on the week for a 21% rebound from the March 9 low. Financials continued to lead the bounce, with the BKX banks stock index up 12% on the week, but their leadership position faded late in the week after a stronger initial outperformance in response to the Treasury’s announcement. In corporate credit, the new series 12 investment grade CDX index tightened 15bp to 184bp in its first full week of trading, while the prior series 11 closed the week near 225bp after hitting a recent wide of 262bp on March 9. The high yield index was 132bp tighter on the week at 1,619bp through Thursday, down from 1,894bp on March 9, but the index was trading off about 3/4 of a point Friday. The leveraged loan LCDX index, which could benefit from the legacy loan portion of the bad bank plan, had a very good week but remained pretty far in the red for the year. Through midday Friday, the index was 379bp tighter on the week at 1,893bp, near its best level since the first half of February but still quite a bit wider than the 1,303bp close at the end of 4Q. The relatively strongest response to the Treasury plan was in the highest-rated parts of the commercial real estate market. The AAA CMBX index tightened nearly 200bp on the week to 559bp, wiping out almost all of the prior year-to-date losses. While the Treasury’s plan was clearly taken as good news for owners of high-quality commercial mortgage-backed securities (though AAA cash CMBS still trades quite a bit wider than the AAA CMBX index at this point, and lower-rated CMBX indices did not perform nearly as well), our desk notes that current spreads are still astronomically higher than where they traded a couple years ago before the financial crisis began – currently about 900bp for AAA CMBS versus only about 25bp pre-crisis. As a result, commercial real estate funding is punishingly expensive even after the recent market rebound, continuing to put intense pressure on commercial property valuations. Meanwhile, a comparatively much weaker performance by the subprime ABX market sharply contrasted with the CMBX strength. The AAA ABX index only gained 2 points from the record lows hit last week and at 26.17 is still down 33% so far this year. Lower-rated ABX indices saw almost no upside from recent record lows, with the AA index only up 0.02 point to 4.04 (incredibly, this index once traded as high as 97.00). Although the muted performance of the subprime market to some extent probably reflected uncertainties about how effective the Treasury’s plan would be, there appeared to be at base a simpler explanation. In contrast to the apparent assumption of the Treasury and many investors, our desk does not believe that current levels in the ABX market, even as far as they have crashed, have been trading at substantially depressed fire-sale prices relative to horrendous underlying fundamentals, so bids well above current market prices for these assets by the PPIFs or through the TALF seem unlikely. ( NB DON )

The past week saw a somewhat more positive tone to the economic data after what’s been mostly a steady run of gloomy results for some time, though underlying details of the figures in many cases weren’t as good as the headline results. For example, home sales rebounded, but there was little improvement in the horrendous inventory situation as we move into the key spring selling season. New home sales rose 4.7% in February to a 337,000 unit annual rate, rebounding from the all-time low hit in January to the second worst reading ever. Even with the number of homes available for sale down for a 22nd consecutive month to a seven-year low, the months’ supply of unsold new homes only moderated to 12.2 months from the record high 12.9 months hit in January. Around 5-6 months of supply would be consistent with a balanced market, so inventories are still completely out of hand heading into the crucial spring selling season. Meanwhile, existing home sales gained 5.1% in February to 4.72 million after hitting a 12-year low, but inventories were unchanged, remaining badly elevated at 9.7 months. Similarly, durable goods orders at first glance looked much better than expected, but underlying details, in particular the extent of the revisions to prior months, ended up being much more negative. Overall durable goods orders jumped 3.4% in February, but this followed a downwardly revised 7.3% plunge in January and still left orders down at a near record 35% annual rate over the past six months. Non-defense capital goods ex-aircraft bookings, the key core gauge, jumped 6.6% in January, but this similarly followed a downwardly revised 11.3% collapse in January, a record decline, and left the recent trend extraordinarily weak. Non-defense capital goods shipments ticked up 0.6% in February but only after a record downwardly revised 8.9% drop in January, pointing to severe weakness in business investment in the first quarter. We cut our forecast for 1Q equipment and software investment to -29% from -24.5% and overall investment to -27% from -24%. A 27% drop in current quarter investment following the 22% fall in 4Q would mark the worst six-month decline since the Great Depression. The inventory drag in 1Q also appears likely to be worse, as durable goods inventories fell a larger-than-expected 0.9% in February on top of a downwardly revised 1.1% drop in January. Note that the drop in sales has been so severe, however, that even with this sharp recent pullback, the I/S ratio in this sector remains very close to a 17-year high. On top of the weakness in durable goods inventories early in 2009, the smaller-than-expected downward revision to 4Q growth to -6.3% from -6.2% (and the way too high -3.8% advance estimate) was partly a result of a smaller-than-expected downward revision to inventories, pointing to a likely greater drag from inventories in 1Q. We now see inventory destocking knocking 2.1pp off 1Q growth instead of 1.5pp.

Against the expected bigger negatives from investment and inventories, the consumption picture at least looks a bit better. Real consumer spending fell 0.2% in February, as expected, but January was revised up to +0.7% from +0.4%. As a result, we now see 1Q consumption rising 1.3% instead of +0.9%. While the swing into positive territory would be a positive development, the upside we’re forecasting would mark a meager rebound after a near-record 4.1% annualized collapse in 2H08. Combining the expected downside in investment and inventories against the upside in consumption and also incorporating our February trade forecast and other underlying details of the 4Q GDP revision, we marginally reduced our 1Q GDP forecast to -5.1% from -4.9%. With 4Q GDP only being revised down to -6.3% instead of the -6.8% we were expecting, the net decline in the economy over the 4Q/1Q period still looks to be extremely severe, but slightly less so than we were forecasting coming into the week.

After some recently rare improvement in some of the economic data seen over the past week, we expect the key early round of March data to have a much more negative tone. We look for the worst employment report yet in this downturn, some renewed weakness in the ISM (though less so than we anticipated coming into the week after better results from the second round of regional reports), and another disastrous month for motor vehicle sales. Key data releases due out in the coming week include consumer confidence Tuesday, ISM, construction spending and motor vehicle sales Wednesday, factory orders Thursday, and employment Friday:

* We look for the Conference Board’s consumer confidence index to rise to 26.0 in March. Both the Michigan and ABC gauges suggest that sentiment was little changed during early March, so we look for the Conference Board measure to hold near the record low of 25.0 posted in February.

* We expect the ISM to decline a point to 35.0 in March. The regional surveys released to this point have been mixed. On an ISM-weighted basis, Empire and Philly posted declines, while Richmond and KC registered gains. So, we look for another relatively steady result on the ISM. The key orders gauge is expected to show an uptick, but employment and inventories should move lower. Finally, the price index is likely to register a pullback this month.

* We forecast a 0.5% decline in February construction spending. The housing starts data suggest that construction activity may have received some temporary support from unseasonably mild weather conditions across parts of the country. So, we look for a much smaller decline in spending than seen in recent months. Renewed weakness in homebuilding and a more rapid pace of decline in non-residential activity should be evident in the coming months. Finally, we don’t expect to see any noticeable support for public infrastructure spending tied to the recently enacted fiscal stimulus legislation until the second half of the year.

* Motor vehicle sales hit a 28-year low of 9.1 million units in February. Anecdotal reports suggest that the sales environment remained miserable in March, and we look for a little changed 9.0 million unit sales rate.

* As foreshadowed by the durable goods data, we look for a sharp 1.9% rise in February factory orders combined with a significant downward revision to January. Meanwhile, shipments are likely to show little change. Inventories are expected to slip 0.7%, with the I/S ratio ticking down a tenth to 1.45 after a major prior run-up.

* We look for a 700,000 drop in March non-farm payrolls. The readings on both initial and continuing unemployment claims are still pointing to a steady deterioration in labor market conditions. However, we actually expect to see an even steeper drop in jobs this month relative to the 650,000 or so declines that were posted in each of the first two months of the year. In particular, we look for some restraint tied to weather-related influences. Although conditions appear to have been near normal during the March survey period, this follows on the heels of much milder than usual weather in February. So, we suspect that favorable weather may have helped to prop up employment in February and this effect could be unwound in March. But any swing to the downside is likely to be tempered by the impact of concurrent seasonal adjustment (a statistical technique that has been used for the past five years or so). Interestingly, all of the large net downward adjustment to the December and January payroll figures in last month’s report was attributable to revised seasonals. The unadjusted figures were actually pushed up a bit. Thus, concurrent seasonal adjustment helped to push up the February reading and offset this by lowering the results for the prior two months. The smoothing process that results from concurrent seasonal adjustment is one reason why the declines in payroll employment seen to this point have not been even larger. Finally, the unemployment rate should continue to move substantially higher to 8.5% from 8.1% (note: we still look for a 9.9% peak by year-end)."

governments should undertake additional measures to boost financial asset prices

From the Economist's View:

"DeLong: Kick-Starting Employment

Brad DeLong:

Kick-Starting Employment, by J. Bradford DeLong, Commentary, Project Syndicate: Unemployment is currently rising like a rocket... In response, central banks should purchase government bonds for cash in as large a quantity as needed to push their prices up as high as possible. Expensive government bonds will shift demand to mortgage or corporate bonds, pushing up their prices.

Even after central banks have pushed government bond prices as high as they can go, they should keep buying government bonds for cash, in the hope that people whose pockets are full of cash will spend more of it...

In addition, governments need to run extra-large deficits. Spending ... boosts employment and reduces unemployment. And government spending is as good as anybody else's.

Finally, governments should undertake additional measures to boost financial asset prices, and so make it easier for those firms that ought to be expanding and hiring to obtain finance on terms that allow them to expand and hire.

It is this point that brings us to US Treasury Secretary Timothy Geithner's plan to take about $465 billion of government money, combine it with $35 billion of private-sector money, and use it to buy up risky financial assets. The US Treasury is asking the private sector to put $35 billion into this $500 billion fund so that the fund managers all have some "skin in the game," and thus do not take excessive risks with the taxpayers' money.

Private-sector investors ought to be more than willing to kick in that $35 billion, for they stand to make a fortune when financial asset prices close some of the gap between their current and normal values. ... Time alone will tell whether the financiers who invest in and run this program make a fortune. But if they do, they will make the US government an even bigger fortune. ...

The fact that the Geithner Plan is likely to be profitable for the US government is, however, a sideshow. The aim is to reduce unemployment. The appearance of an extra $500 billion in demand for risky assets will reduce the quantity of risky assets that other private investors will have to hold. ... When assets are seen as less risky, their prices rise. And when there are fewer assets to be held, their prices rise, too. With higher financial asset prices, those firms that ought to be expanding and hiring will be able to get money on more attractive terms.

The problem is that the Geithner Plan appears to me to be too small - between one-eight and one-half of what it needs to be. Even though the US government is doing other things as well -fiscal stimulus, quantitative easing, and other uses of bailout funds - it is not doing everything it should.

My guess is that the reason that the US government is not doing all it should can be stated in three words: Senator George Voinovich, who is the 60th vote in the Senate - the vote needed to close off debate and enact a bill. To do anything that requires legislative action, the Obama administration needs Voinovich and the 59 other senators who are more inclined to support it. The administration's tacticians appear to think that they are not on board - especially after the recent AIG bonus scandal - whereas the Geithner Plan relies on authority that the administration already has. Doing more would require a legislative coalition that is not there yet.

We're losing, roughly, 600,000 jobs per month, which is about 20,000 per day. There are many costs associated with job loss, but I wonder how many foreclosures per day are generated from the loss of 20,000 jobs? And that's in addition to the foreclosures we'd have anyway.

The administration has an obligation to protect people from cyclical fluctuations in the economy, to help them avoid losing their jobs, their houses, and other sources of security. For example, if bank nationalization is the safer path to pursue ex-ante to stabilize the banking system, then that means convincing the 60th vote in the Senate, one way or the other, to support the action. If more fiscal stimulus, or a larger version of the Geithner plan is needed, then there should be no rest until the votes are there. If the "tacticians appear to think that they are not on board," or someone takes the time - as I hope they did - to ask them and finds out that, in fact, they aren't aboard, then do whatever it takes to change that.

Maybe the effort was there prior to the Geithner plan, and maybe the effort is there now to try to enhance the Geithner plan through legislative authority, to set the stage for a second stimulus in case it's needed, and to change the public perception of what has been done to date. Perhaps a lot of it is behind the scenes, and all that can be done, is being done. Maybe the administration is saving political capital for other things. But prior to the announcement of the Geithner plan, I had the impression that many of the minds within the administration that counted the most were already made up, or if not fully made up that they had a preference for clever market-based solutions (that the public had no hope of understanding, which makes obtaining the public's support much more difficult), and that stood in the way of a true full court press toward nationalization. As for now, I also wonder if concerns within the administration about the deficit are causing hesitation to pursue more aggressive policies. So I'm not so sure that Voinovich was and is (or will be) the only thing standing in the way.

Posted by Mark Thoma on Tuesday, March 31, 2009 at 02:07 AM"

Me:

"Even though the US government is doing other things as well -fiscal stimulus, quantitative easing, and other uses of bailout funds - it is not doing everything it should."

I'll give credit to De Long for seeing that PPIP has an effect on QE, and is one of its benefits.

"Unemployment is currently rising like a rocket"

This is the real problem. If you follow a version of Fisher's Debt-Deflation model, we are currently in it. The unemployment figures are the result of a Proactivity Run, in which employers lay workers off in anticipation of worse times to come. In other words, they are laid off even faster than demand drops. In order to get out of this trap, we need to induce inflation. Inflation will end the Debt-Deflation and ease the laying off of workers. Models describing some natural level of downward spiral are fine, but are inconsistent with a Debt-Deflationary Spiral, precisely because no one knows or can predict its stopping point. This is not simply a lack of knowledge, but part of the inherent nature of Debt-Deflation.

Posted by: Don the libertarian Democrat