Showing posts with label VIX And More. Show all posts

Friday, April 10, 2009

When the VXV is able to make it back below 30, I suspect this will be an indication that systemic risk is once again at a manageable level.

TO BE NOTED: From VIX And More:

"Chart of the Week: VXV and Systemic Failure

When it comes to the chart of the week, anything goes. Now it its six month, this regular feature can highlight anything from an important economic data release to interest rates, bonds, index performance, market internals and even my strange and unusual ratios. My intent has been to keep volatility in the loop, but generally cast a wide net each week.

This week I am focusing on volatility, but probably not a measure that many readers pay attention. Specifically, I am speaking of the VXV. This index is essentially a 93 day version of the VIX, but for those who are interested in further digging, a good place to start is with my December 2007 Thinking About the VXV.

One reason I think the VXV is worth following is that I believe it gives a better perspective on structural volatility and systemic risk than its short-term counterpart, the VIX. For more on this subject, I encourage readers to check out my November 20, 2008 post, The VXV and Extreme Structural Volatility Risk.

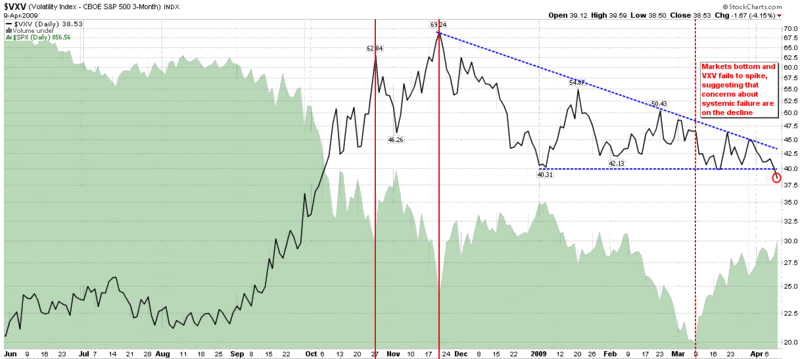
All this brings us to the chart below. The quick takeaway is that according to the VXV, structural volatility and systemic risk peaked on November 29th and has been in a decline ever since, as the dotted blue descending triangle reflects. I have also included three vertical red lines to show significant market bottoms. The first two generated significant VXV spikes and were eventually violated. The most recent bottom, which resulted in the SPX hitting 666, is shown with a dashed vertical red line. An important feature of that bottom is that the VXV did not spike, suggesting that there was no increase in systemic risk – perhaps part of the reason why the 666 bottom has held.

Finally, note that as of Friday (red circle), the VXV has dropped to levels not seen since the first week in October. The key takeaway: systemic healing is continuing and the risk of systemic failure is diminishing. When the VXV is able to make it back below 30, I suspect this will be an indication that systemic risk is once again at a manageable level.

[source: StockCharts]

Saturday, March 28, 2009

learning about options from scratch and are looking for suggestions on how to proceed

TO BE NOTED: From VIX And More:

"Learning About Options (1)

I have recently received several requests from readers who are interested in learning about options from scratch and are looking for suggestions on how to proceed.

First, I should preface my answer by saying that even if you never intend to trade options, it will probably be worth your while to take some time to understand how they work. At the very least, it is helpful to appreciate what is in the black box that generates various options indicators, such as the VIX and the put to call ratios.

Second, I intend on making this the first installment in a series of posts that cover the subject of learning about options. Today I will talk about two excellent general resources on the web; in later posts I will examine educational resources offered by the exchanges and several options brokers, recommend some books, discuss additional web sites and conclude with an overview of some of my favorite options blogs.

The subject of options is broad and deep. Fortunately, there are some excellent free resources on the web that allow someone who is interested in options to learn at their own pace and in small chunks of ideas and information.

Two excellent all-purpose resources for options beginners are The Options Guide and The Options Industry Council (OIC). I mention these two sites first, because their sole intent is to inform and educate, unlike some commercial sites that provide some free information and then try to sell you something with a subtle or sometimes not-too-subtle approach.

The Options Guide has a variety of short articles in their Options Basics section, as well as a handy Options Strategies reference, where you can search for specific types of options strategies that meet your needs, or click on an excellent visual menu of profit and loss graphs to get detailed information about a wide variety of strategies. There are even separate sections for index options and VIX options.

The Options Industry Council takes a comprehensive approach to education. While The Options Guide is a great starter kit and reference tool, I consider the OIC’s web site to be the gold standard. It is a great place to browse and get lost. If you want articles, DVDs, books, brochures, etc. on just about any options topic you are interested in, there is a good chance you will find it in the OIC’s online vault. The OIC has embraced a multimedia approach and as a result, offers online classes, as well as seminars and webcasts. You can see what material is available as a video webcast and also download a wide variety of podcasts.

The OIC also has a broad range of tools that includes a several options calculators, an options strategy screener and a position simulator. If that is not enough, you can even do some virtual trading through the OIC.

Considering that everything offered by The Options Guide and just about everything (books are an exception) offered by the Options Industry Council is free, investors who are interested in learning about options should put these two web sites at the top of their list when embarking on a self-study approach to learning about options."

And:

"Learning About Options: The Exchanges (2)

When I first started drafting yesterday’s Learning About Options (1), I initially intended a brief overview of sources for those interested in teaching themselves about the subject of options. The more I thought about it, the more I decided that I really needed a multi-post series to properly address the subject and based on the enthusiastic response to the first post in this series, I am glad to have chosen that path.

In keeping with yesterday’s theme of free content from independent sources, today I wish to focus on the options exchanges. In the world of options exchanges, there are two large players at the top of the food chain. The Chicago Board Options Exchange (CBOE) is the undisputed leader in index options and a close second to the International Securities Exchange (ISE) when it comes to single-equity options volume.

The younger, all-electronic ISE has recently made a push to become more involved in education. The majority of the content for the ISE’s educational offerings utilize content from the Options Industry Council that I referenced in yesterday’s Learning About Options (1). This includes basic and advanced articles about options, a description of various options strategies, as well as several trading tools and online classes in options for beginner, intermediate and advanced traders.

In terms of non-OIC content, the ISE offers webinars and podcasts, but so far these have focused almost exclusively on foreign exchange trading, which I find more than a little disappointing. At this time, the ISE has posted over 350 videos in a YouTube ISE Options Education repository. Once again, forex is the dominant theme.

While the ISE has some material of interest, the CBOE has taken options education to an entirely different level, with a large amount of original content, covering a broad array of subjects and presented in just about every format imaginable. The CBOE even has a dedicated options education arm, The Options Institute, which offers a comprehensive set of tutorials, more detailed online courses, webcasts, seminars, “master sessions” with guest speakers and even customized programs. You can find these and most of the CBOE’s educational materials at the CBOE’s web site under the Learning Center tab.

Adjacent to the Learning Center tab are some options Strategies materials that are also worth checking out. In addition to information about the usual equity options strategies, the strategy tab includes information on LEAPS and index options that are rarely even acknowledged elsewhere on the web. More detailed explanations of advanced options strategies can be found in the archives of the Weekly Strategy Discussions.

The CBOE has also done some excellent work with top tier partners in the options space. The exchange has partnered with iVolatility.com to offer free IV index and options calculator tools, as well several premium options tools that come with free trials. For those who may be interested in virtual trading, the CBOE has two different approaches, based on partnerships with two of the top options brokers. The CBOE has worked with optionsXpress to deliver Virtual Trade Tool and with thinkorswim to offer paperMoney, each of which are virtual trading modules that are excellent ways for beginning traders to become familiar with the options trading process without putting real money at risk.

In terms of news, commentary and analysis, CBOE-TV continues to ramp up and has 3-4 new videos each trading day from the likes of Jon Najarian, Dan Sheridan and Angela Miles. This includes a great deal timely information that addresses options movers, economic data releases that are moving the market, etc.

Some of the newer features just rolled out this week include the Strategy of the Week program with Peter Lusk on CBOE-TV and a market commentary, which includes weekly articles from the staff of InvestorsObserver.

As you can see from some of the information I chose to highlight above, the CBOE offers best in class options education products and services, for the beginner to the advanced practitioner. If you are interested in learning about options, the CBOE is an invaluable educational resource.
Tuesday, January 20, 2009

"zombie banks will always look more attractive than they should due to the penchant for overly optimistic estimates"

VIX And More on Zombie Banks. I'm thinking of writing a sequel to my vampire novel featuring zombie banks:

"With talk of nationalization of European and American banks heating up, I want to make sure everyone had a chance to read Paul Krugman’s Wall Street Voodoo from Sunday’s New York Times. Krugman tackles the issue of so-called ‘zombie banks’ that can still operate while technically insolvent and whose market capitalization, says Krugman, “is entirely based on the hope that shareholders will be rescued by a government bailout( TRUE ).”

Krugman lays out three policy alternatives for addressing these zombie banks:

  1. sufficient government funds to support the operation of the existing entity
  2. seizure of the bank by the FDIC with a transfer of toxic assets to a third party (a ‘bad bank’ or ‘aggregator bank’ along the lines of the Resolution Trust Corp. model), followed by the resale of the now solvent bank( MY VIEW )
  3. transfer of toxic assets to a third party, without prior government seizure of the bank

The concern Krugman has is that the Obama administration is leaning toward the third alternative, which rewards bank shareholders at the expense of taxpayers and perpetuates the moral hazard problem.( I AGREE WITH KRUGMAN )

John Hempton offers up a challenge to the zombie bank solvency question in Voodoo Maths and Dead Banks. Hempton claims that banks whose liabilities currently exceed assets can earn their way back to solvency if the net interest margin is sufficient to generate enough operating income to overcome the gap between liabilities and assets, hopefully in the span of a few years.

Hempton makes some excellent points and provides a philosophical foundation for much of the current approach. Given that there a lot of moving parts, the success of these efforts are ultimately going to be the result of several key factors, including:

  • the gap between liabilities and assets
  • the spread (net interest margin) banks will be able to realize going forward
  • the length of the economic contraction

From a government policy perspective, monetary policy will have a strong influence on bank spreads and fiscal policy will go a long way to determining the magnitude and length of the economic contraction.

Zombie banks can earn their way back to solvency in just the same manner that a homeowner who is underwater can continue to make mortgage payments until he or she crosses back into a positive equity situation in their home. The key for the banks is a healthy interest rate spread and a relatively brief recession that keeps loan losses from getting out of hand.

The problem with propping up zombie banks is that it may be too attractive of an alternative politically to prompt proper consideration of other options. Further, zombie banks will always look more attractive than they should due to the penchant for overly optimistic estimates of the gap between liabilities and assets( AND BS ) as well as hopes morphing into beliefs that the economic downturn will be shorter than what the next pundit says."

"

The banks are not to be believed in putting a price on the toxic assets. They will attempt to continue getting the government to prop them up while they are allowed to continue as private concerns. It's a recipe for a long and costly relationship.

Wednesday, January 14, 2009

the VIX has spiked all the way to 51.03, up 17.9% so far today and up 32.3% from just six sessions ago.

Since this kind of measure interests me, I can't say that it's good news for the near future. From Trader's Narrative:

"Conference Board Consumer Confidence At New All Time Low

The Present Situation Index of the Consumer Confidence

survey from the Conference Board fell to 29.4:

confidence board consumer confidence present situation Jan 2009

That’s lower than the 2002 bear market bottom. Lower than the confidence level in 1991. Lower than the early 1980’s. Even slightly lower than the darkest days of the 1970’s bear market.

As far as I can tell, the current reading is the lowest that this survey has seen since it was started in the 1960’s!

The Conference Board surveys 5000 US households and their answers to questions about their employment, spending and

From a contrarian perspective this is good news. And this is just another in a long line of extreme pessimism from the average consumer and investor in the US. But from another perspective we need to see at least the start of a change in the doom and gloom before things get better.( I AGREE ABOUT BOTH POINTS )

If you have a really long term view and don’t particularly care about further declines in the short term, then this is a good signal( TRUE ). But if you want to avoid such potential losses then you have to give up trying to anticipate the market’s exact inflection point and wait for confirmation by giving up some gains to the upside."

In my view, the VIX and TED are places that I would look for things to begin to get better, because I believe that the market will begin to get better before the overall economy does. So, let's look at the VIX on VIX And More:

"VIX Tops 50 for First Time Since Mid-December

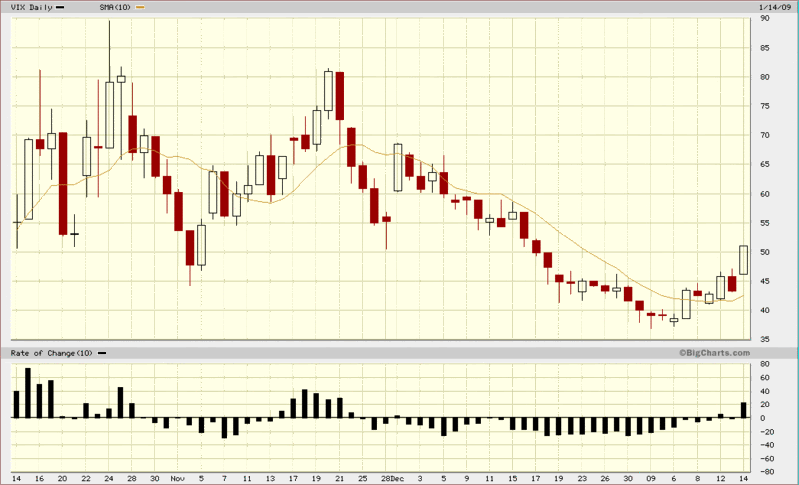
With the SPX failing to find support at 850 and financials falling another 6% this morning, the VIX has spiked all the way to 51.03, up 17.9% so far today and up 32.3% from just six sessions ago.

Since the large gap down at the open, today’s action has been more of a slow grind than a sharp panic, suggesting that there could be a fair distance still to the down side. SPX support may come in the 820-830 range, but if those levels fail to hold, the possibility of a drop back down to 740 suddenly looms large.

[source: BigCharts]

No good news here, I'm sorry to say. Next week is a big week for me, since I believe that the end of the Bush administration will be greeted with a jolt of new found confidence, once we have been delivered from this plague of incompetence.

Sunday, January 4, 2009

"highlight the index as a means of tracking the rise of volatility in response to major volatility events during the course of the past year."

From VIX And More, a very useful chart:

"The Year in Global Volatility

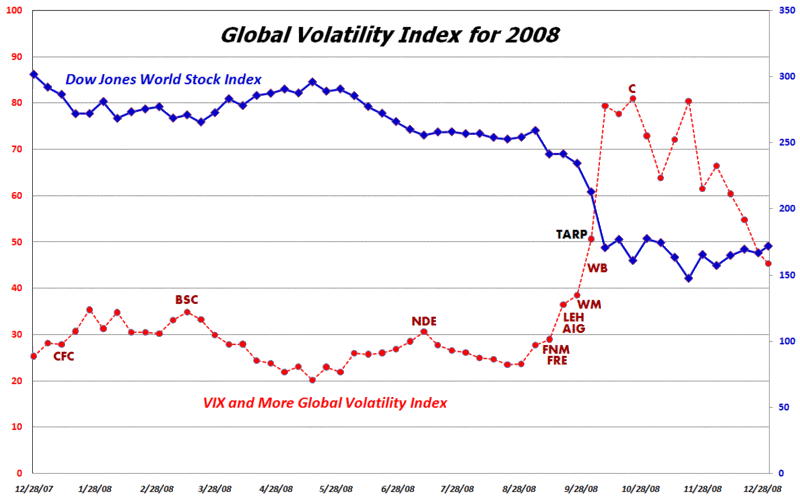
In November I launched the VIX and More Global Volatility Index, which is a weighted average of the implied volatility in options for equities in the 15 largest global economies. I will have more to say about the Global Volatility Index in 2009, but want to use this occasion to highlight the index as a means of tracking the rise of volatility in response to major volatility events during the course of the past year. In addition to the Global Volatility Index (shown in red), the chart below captures the Dow Jones World Stock Index (blue), as well as the signing of the TARP legislation (black) and the tickers (dark red) for some of the major financial companies that failed and/or were rescued by the U.S. government.

[source: VIX and More]

"

My own view has to do with Implicit and Explicit Government Guarantees. I say that my view looks pretty good. From Fannie/Freddie to Citi it has all been about government guarantees, which are needed to stop the Calling Run that began with Lehman. I'll chart the week to week developments sometime in the future. But one can see that, even though the Calling Run continues, the Volatility index has declined. I attribute this to the degree of confidence investors have in government intervention. It started to turn around from Lehman with the open-ended Citi bailout.

Saturday, January 3, 2009

"I find it interesting that the manufacturing index has been slowly trending down since hitting a high in May 2004."

A nice comparison on VIX And More:

"Chart of the Week: ISM Plummets

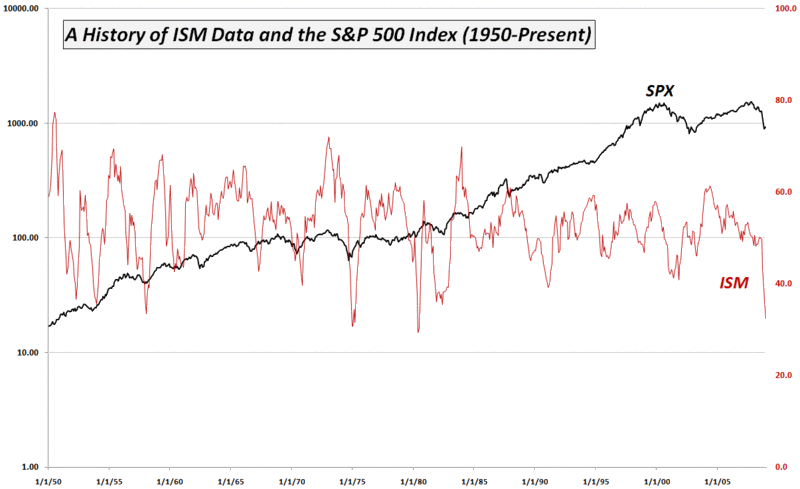
The stock market may have shaken off the December ISM’s 32.4 number, but investors should keep in mind that in the 61 year history of the ISM index, only three previous recessions (1949, 1974-75 and 1980) have seen lower ISM numbers. Even more concerning than the headline manufacturing index number was the report that new orders are now lower than they have been at any time in the 60 year history of the data.

The chart of the week below captures in ISM and the SPX from 1950. In addition to the obvious cliff dive that began in September, I find it interesting that the manufacturing index has been slowly trending down since hitting a high in May 2004.

As an aside, in 2009 I intend to devote more space on the blog to macroeconomic issues (particularly housing, manufacturing and consumer spending), as well global events that shape the geopolitical and economic landscape.

[source: Institute for Supply Management, VIX and More]

Wednesday, December 31, 2008

"If the BDI fails to rally in 2009, be skeptical of any rally in stocks."

An excellent post on VIX And More:

"Watch the Baltic Dry Index in 2009

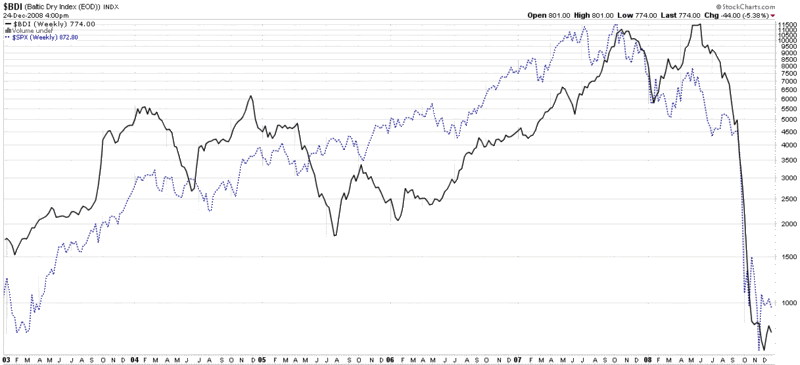
In 2009 investors will be scanning the globe for signs of economic recovery or deterioration. Among the many tools they should be watching in order to gauge the strength of global trade is the Baltic Dry Index (BDI.) The Baltic Dry Index measures shipping rates for dry bulk carriers that carry commodities such as coal, iron and other ores, cocoa, grains, phosphates, fertilizers, animal feeds, etc. In short, the BDI is an excellent proxy for global trade.

In the chart below, note how the BDI peaked after the S&P 500 index did in 2007 and bottomed after the SPX last month. The BDI may not be a leading indicator, but it is an important way to confirm whether moves in global equities are being reflected in an increase in global shipping. If the BDI fails to rally in 2009, be skeptical of any rally in stocks.

For those who are interested in following stocks of some of the leading dry bulk carriers, a good place to start is with Diana Shipping (DSX), DryShips (DRYS), and Excel Maritime Carriers (EXM).

[source: StockCharts]

"

This is very good advice.

Tuesday, December 30, 2008

"the VIX futures continue to reflect expectations of a rising VIX over the course of at least the next 2-3 months"

From Vix And More:

"
Tuesday, December 30, 2008

VIX Close of 41.63 Is Lowest in Three Months

The last time the VIX closed below 42.00 was way back on October 1st, when the VIX closed at 39.81.

Before anyone gets excited about the possibility of the VIX back in the 30s, I should note that the VIX futures continue to reflect expectations of a rising VIX over the course of at least the next 2-3 months. Today’s VIX January futures settled at 44.18 and the February futures settled at 45.08. Futures for August through October are now priced in the 37-38 range, however, suggesting that volatility expectations are being lowered for the second half of 2009.

I still think that it signals a diminution of the fear and aversion to risk.