Showing posts with label Jumbo Mortgage. Show all posts

Friday, March 27, 2009

a dramatic acceleration in the pace of foreclosure starts for non-agency jumbo prime mortgages, LPS said

TO BE NOTED: From HousingWire:

The prepayment rates for borrowers at various stages of delinquency show current borrowers are refinancing at rates exceeding those seen among 30-day and 60-plus-day delinquencies. (source: Lender Processing Services Inc.)

Jumbo Prime Foreclosure Starts Spike: Report

Posted By DIANA GOLOBAY
March 27, 2009 2:35 pm

Mortgage delinquencies declined by 1 percent in February from December 2008, when in the past during the December to February season, delinquencies have declined an average 6.5 percent, according to a monthly Mortgage Monitor Report released Friday by Lender Processing Services Inc. ([1] LPS: 30.41 -0.75%). Total February delinquencies are now at 8.37 percent. The data also show a dramatic acceleration in the pace of foreclosure starts for non-agency jumbo prime mortgages, LPS said.

February posted the largest single-month percentage increase in foreclosure inventories since December 2007, LPS said. The February foreclosure rate increased 8.2 percent month-over-month and 75 percent year-over-year, to a total rate of 2.23 percent. Non-agency foreclosure sales continued a downward trend in the month, while FHA foreclosure sales followed suit, ticking down toward record lows. “The moratorium on Fannie Mae ([2] FNM: 0.72 -2.70%) and Freddie Mac ([3] FRE: 0.80 -4.76%) foreclosure sales expired on January 31 and was reinstated on February 13, to continue through the end of March,” LPS analysts said in a media statement regarding the report. “During the two-week period when the moratorium was lifted, agency foreclosure sales approached all-time highs.”

Agency foreclosure starts from December to February surpassed FHA foreclosure starts, although private-party foreclosure starts still hold the highest pace of starts. Subprime is still king of the roost when it comes to foreclosure starts by product, though the category did show a bit of a decrease in the past month. Option ARMs soared past Alt-A in terms of foreclosure starts, although both hold at historic highs.

RealtyTrac [4] in mid-March reported surprising data: foreclosure filings, which were driven by new defaults and reported REO inventory, surged for the month, although actual foreclosure sales had fallen. The foreclosure halts in place at the GSEs and some major banks kept many properties from going through the foreclosure sale process for a time, but they did nothing to keep borrowers from entering the process after becoming delinquent. The effect is a backlog of properties somewhere along the way from a notice of default to becoming REO. That backlog, once the stops are removed, leads to an influx of foreclosure sales.

LPS’ data show the volume of first payment defaults — when a borrower becomes delinquent defaults without a single payment — on Federal Housing Administration-insured mortgages has reached historic highs recently and spiked up again in December after November’s lull. When taken with historic highs of FHA originations as a percentage of the total volume of originations, this observations loses some of its shock. As LPS noted, “there has been no observed increase in the rate of first-payment defaults for either FHA or non-government loans.”

LPS, which also studies the prepayment rate — or the rate of refinance, which treats a mortgage in a loan pool as paid-in-full, although the loan has not disappeared but simply moved to a different pool — found that the rate of prepayment among borrowers current on payments has spiked considerably from December to February and now sits at a high not seen in the reported data from January 2007. The prepayment rates among delinquent borrowers, however, has not changed much in the last few months and are lingering far below the rate for current borrowers. These data suggest delinquent borrowers are not able to refinance as easily as current borrowers. Additionally, LPS found that refinance activity in the last several months has been “concentrated primarily in the highest FICO category” of 720 plus. “Prepayments have continued to increase significantly, but refinance liquidity is concentrated most in borrowers who need help least,” LPS said.

Modification, an alternative to refinance in which the borrower can reach some other repayment plan with the lender, did not fare particularly better in recent months, according to the data. The rate of recidivism — or re-default after modification — has improved little. According to LPS, continued recidivism rates exceeding 50 percent six months after modification attest to the “quality” — or lack thereof — inherent in the volume of modifications made during the fourth quarter 2008.

A look into roll rates — or the rate at which loans move from one stage of lateness or delinquency to another, ultimately to 90 plus days delinquent or real estate-owned — shows a startling trend that has developed after the burst of the housing bubble. Overall, the volume of loans rolling from better to worse has outpaced those rolling from worse to better for much of 2008. A brief glance at February’s data would almost give the impression that worse-to-better roles are racing to catch up, meaning borrowers are finding some means of payment. While essentially this assumption is true, LPS was quick to point out that the worse-to-better roll rate included a recent surge in refinanced mortgages, which shows up as an influx of prepayment and pulls a mass of borrowers out of the delinquent buckets and into the paid-in-full bucket.

“When the prepayment impact on roll rates is removed, the trend toward higher rates of loans improving in status is eliminated and there is no observed increase or decrease in that category over the last several years,” LPS said.

The six-month increase in the percentage of loans rolling from 30 days delinquent to 60 days delinquent — or from bad to worse — was highest in the Anchorage, Alaska metropolitan statistical area (MSA), followed by the Seattle-Bellevue-Everett, Wash. MSA and the San Francisco-San Mateo-Redwood City, Calif. MSA. Taking the middle slots of the top 10 MSAs were New York-White Plains-Wayne, N.Y.-N.J.; Santa Rosa-Petaluma, Calif.; Edison, N.J. and Lake County-Kenosha County, Ill.-Wis. The bottom of the top 10 list filled out with an Oregon-Washington MSA and another California and New York MSA.

Jumbo Prime took the cake in terms of which product showed the highest deterioration in 30-to-60-day roll rates from February to July 2005, followed by non-agency conforming prime.

Read [5] the statement and [6] full report.

Saturday, January 10, 2009

would again raise the limits on “conforming loans,” which are mortgages eligible to be purchased by Fannie Mae and Freddie Mac,

The Jumbo Problem. From the NY Times:

"
Will Loan Limits Rise?


IF you’re in the market for a new home, especially in an area where housing prices are typically high, it might make sense to wait a few weeks. Doing so could mean a significant reduction in your monthly mortgage bill — that is, if the lending industry and Congressional leaders have their way.

Both groups have been lobbying President-elect Barack Obama to include in an economic stimulus package a provision that would again raise the limits on “conforming loans,” which are mortgages eligible to be purchased by Fannie Mae and Freddie Mac, two government-sponsored agencies that resell packages of loans to investors.

Last year, the conforming loan limit was temporarily increased from $417,000 to $729,750 in the New York City area, and to $708,750 in Fairfield County, Conn. (Loan limits are based on median home prices; in areas with lower home prices, it was $625,500.) The limit was raised to help to bolster demand for higher-priced houses in a slumping real estate market.

The government made a similar attempt to spur sales in late 2007, when it decided to keep the conforming loan limit at $417,000, reversing a longstanding practice of moving the limit in accordance with the housing market. (Because the average home price fell in 2007, the limit should have been reduced.)

On Jan. 1, the conforming loan limit was set at $625,500 in all regions, disadvantaging borrowers in areas of higher-cost housing like New York City.

Interest rates on nonconforming, or jumbo, mortgages are typically higher than rates on conforming loans because they are considered riskier without a guarantee that Fannie Mae and Freddie Mac will buy them( GOVERNMENT GUARANTEES ). The agencies are required by law to buy only conforming loans.

Looking to improve real estate sales in higher-cost areas, the provision sought by Congressional leaders would put the conforming loan limit at $729,750.

Borrowers with 30-year fixed-rate loans of $417,000 to $625,000 — categorized as agency “jumbo loans” — pay about three-quarters of a percentage point less than those with the conventional jumbo mortgages (though they pay about a quarter of a percentage point more than those with mortgages below $417,000).

By changing the “jumbo conforming” terms to include a hypothetical $700,000 mortgage, a borrower with good credit would qualify for a 5.25 percent interest rate on a 30-year fixed-rate mortgage, based on current rates, rather than the average 6 percent rate for jumbo mortgages, according to Oded Ben-Ami, a senior loan officer with the Sterling National Mortgage Company in Great Neck, N.Y.

Monthly payments on that $700,000 mortgage (excluding property taxes and insurance) would drop to $3,865 from $4,197, Mr. Ben-Ami said. The borrower would also save on fees — to get the jumbo mortgage, he or she would have had to pay a “point,” or an additional $7,000 upfront fee.

While borrowers who choose to wait for the government to change the conforming loan limit could derive significant savings, Mr. Ben-Ami says they are also “taking a gamble.”

Interest rates could increase, he said, and banks could place restrictions on loan amounts or further tighten their lending criteria. (Some in recent months have required borrowers to prove that they have liquid assets equaling 25 percent of the loan amount.)

Another element of risk, Mr. Ben-Ami said, is the borrower’s own financial situation.

“If you can qualify now while you still have a job,” he said, “should you make your move now?”

Other mortgage specialists urged borrowers not to wait.

Stephen Habetz, the chief executive of Threshold Mortgage in Westport, Conn., said, “Homeowners with large loans who are waiting on the sidelines may well find long delays and not the large drop in rates they are anticipating.”

At the start of January, Mr. Habetz noted, there was already a backlog of mortgage applications ready to be processed. "

I'm not for raising the limit.

Tuesday, January 6, 2009

"throw out everything you thought you knew about mortgage and housing — very little that excite the markets are actionable in reality"

Mr. Mortgage with an excellent post on what's going on with mortgages. I'm not happy, but it's what I felt would happen to new mortgages with falling mortgage rates, which is not much. The refi situation puzzles me though:

"The Very Flawed Weekly Mortgage Applications Survey

Posted on January 6th, 2009 in Daily Mortgage/Housing News - The Real Story, Mr Mortgage's Personal Opinions/Research

Mortgage and housing are back in the spotlight like never before. Everywhere you look there are silver linings, lights at the ends of tunnels and ‘mustard seeds’ of hope. This is all great — I encourage hope as a broader theme in life. But ‘hope’ should not be the primary metric in an important business or investment decision — most analyst and media have based their mortgage and housing analysis primarily on ‘hope’ for the past two years.

Since conforming mortgage rates (= or <$417k) fell from 5.875% - 6.125% in November to the 5.25% - 5.5% range today, there has been increasing hype surrounding the weekly mortgage applications survey. In the past, this has been a decent measure of future refi and purchase loan fundings but not any longer.

In mid-December, a weekly release was put out that citing results that compared with 5-years ago. The bottom calling rush was on. The end result was scores of media, economists and analysts calling for the ‘great refi-boom’ to carry the nation out of its housing crisis and onto great things.

Of course, the primary thesis was that ‘if the refi market is at the same pace as 2003 then what followed 2003 in housing, mortgage and the macro economy may follow’. This is not the case. The fact is that refi loan application counts are far fewer than 2003 levels and actual loan fundings far less than that. Data being represented in this manner have led to several disappointments over the past two years. The fall out makes for less trust and weaker markets.( VERY TRUE )

Does anyone really believe that with 60% of CA, AZ and FL home owners and over 90% in NV in or near negative equity that refi’s can be anywhere near 2003 levels?

By virtue of the headline number being ‘near 2003 levels’, it highlights the imperfections with the survey. Remember, at the end of 2003 the nation was in the midst of a mad refi and purchase boom and the first few innings of the ‘Great Bubble’. Rates on intermediate-term interest only ARM money were in the 4%’s, fixed were in the 5%’s. Everyone could get and loan because of easy qualifying and stated income and there was no negative-equity — 70% to 80% of all loan applications actually funded compared to 35% to 45% today.

Mortgage applications have increased in recent weeks and subsequent fundings will as well…there is little doubt about that. Some will be able to do well taking advantage of today’s low rates, which is great for those individuals. But is putting the home owner who is already in a great position into a little better position really going to do much for the broader housing market and economy( IT WILL HELP LOWER DEBT )? The fact remains that for the majority, those that don’t need the credit can get it and those that do can’t. ( BAD NEWS )

Housing is in the perfect credit crisis storm; one which low rates alone( TRUE ) can’t ‘fix’ nor provide much protection. Mid-year 2007 when it was plainly obvious that unless something was done immediately the fall-out could be devastating — this measure may have made the difference between a housing recession and absolute implosion. Instead we heard ‘contained’ rhetoric for over a year.

Now with home prices at the median down 50% in the bubble states so vital to the nation’s economy and $9 trillion in guarantees made to most every other sector but residential real estate, the move is a day late and 5% short. As a matter of fact, even if rates were zero, it could not help the borrowers that need it the most.

The TRUTH About Mortgage Applications

The weekly survey only covers the top 10 lenders by volume

Back in 2003 through 2007, there were hundreds of national lenders. The top 10 were a driving force then but today the top 10 do the lion’s share of all loans. Therefore, even though the top 10 lender’s volume maybe equal to 2003, total national application volume is far less.

Portfolios shift from one lender to the next as rates fall - double, triple, quadruple counting

Most banks will not just roll-down a rate lock to current market if rates tumble after the borrower locks in. Some will but at a large fee. Rates tumbled a few separate days on news events in December and then backed up over subsequent days. On days when rates tumble, borrowers and brokers re-lock their loans with other banks in order to get a rate better than the one they have locked in — entire portfolios can switch lenders multiple times.

Therefore, much of last week’s jump in mortgage applications was much of the previous month of already counted loan applications switching to different lenders for the best rate. Many borrowers have four or five loan applications going with different banks simultaneously. These are all counted in their respective weekly surveys.

With three to four week underwriting and six to eight week total turn times to get a loan done right now, borrowers and brokers are not loyal to the lender at which their loan is in process making it very easy to switch. Ironically, a major reason for the long turn-times in getting a loan done is because of the long-turn times. Obviously, banks can lose a lot of productivity and revenue when losing loans worked for weeks during these volatile times. Additionally, when banks have no clue about what in their pipeline is real or what will actually fund, it is nearly impossible to hedge with any accuracy and can lead to incredible losses.

Loan applications do not necessarily lead to fundings. The overall fall-out rate is at an all-time high.

Back in 2003-2007 due to the variety of loan programs and easy approvals, 70%-80% of all applications actually funded. During these times, tracking the weekly survey was valuable. Now, 35-45% fund. Even less fund when rates are highly volatile due to the reasons explained in the previous bullet point.

The primary reasons for fall-out during 2008 were because a) the property value is too low b) the borrower does not qualify due to today’s sensible standards( I AGREE ) c) the rates are not really as low as the borrower has heard advertised by the media for their specific case d) and there is nothing in the Jumbo arena that makes sense for anyone( TRUE ).

Middle-market mortgage bankers are not pulling their weight leading to fewer fundings - they may never be able to

From HousingWire - As Refi’s Swell, Is There Enough Credit

The volume of warehouse credit providers has fallen recently from 30 to about 10, according to an article featured last week by American Banker, raising the question as to whether there is enough warehouse capacity to handle a refinance boom that has clearly surfaced in the past week.

“[I'm] not sure what mortgage companies are going to do, but there is no way all these loans will get funded any time soon with no warehouse money,” said one of HW’s sources, a mortgage banker who spoke on condition of anonymity.

A better gauge of mortgage applications

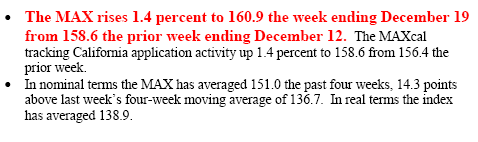
Lastly theMaxx, a research firm that I rely upon to gain more clarity on the real mortgage application counts, confirmed my research in its 12-22 issue. TheMaxx eliminates all multiple applications. They show applications only up 1.4% week over week. More importantly, theMaxx is at 158 today after this surge in applications and got in the 300’s back then. When you consider that back then 70-80% of all applications funded and now 35-45% fund, you see how bleak the picture is. Apples to apples, actual refi loans are down at least 60% at best.

In summary, The reporters covering the weekly survey must be getting analysis and PR help from the now infamous Lawrence Yun or David Lereah. This is just another example of why you have to throw out everything you thought you knew about mortgage and housing — very little that excite the markets are actionable in reality. -Best Mr Mortgage"

Thursday, December 25, 2008

"remains almost 2 percentage points above conforming rates and the spread between them may set a record this month"

Calculated Risk with an interesting point:

"Freddie Mac reported Long-Term Rates Fall for Eight Consecutive Week Setting Another New Low

Freddie Mac today released the results of its Primary Mortgage Market Survey® (PMMS®) in which the 30-year fixed-rate mortgage (FRM) averaged 5.14 percent with an average 0.8 point for the week ending December 24, 2008, down from last week when it averaged 5.19 percent. Last year at this time, the 30-year FRM averaged 6.17 percent. The 30-year FRM has not been lower since Freddie Mac started the Primary Mortgage Market Survey in 1971.
The MBA reported: Near Record Low Mortgage Rates Boost Mortgage Applications in Latest MBA Weekly Survey
The average contract interest rate for 30-year fixed-rate mortgages decreased to 5.04 percent from 5.18 percent, with points increasing to 1.17 from 1.13 (including the origination fee) for 80 percent loan-to-value (LTV) ratio loans. The contract rate for 30-year fixed-rate mortgages is the lowest recorded in the survey since the record low of 4.99 percent for the week ending June 13, 2003.
Note the surge in refinance applications too!

However, Bloomberg reports: Jumbo Mortgage Shoppers Get Little Relief From Rates
Jumbo mortgage shoppers in the most expensive U.S. housing markets such as New York and San Francisco aren’t getting much relief from lower borrowing costs.

The average 30-year fixed rate for home loans of more than $729,750 remains almost 2 percentage points above conforming rates and the spread between them may set a record this month, according to financial data firm BanxQuote.
...
The difference between the two averaged 2.13 percentage points in December, 10 times the spread from 2000 to 2006 and above last month’s 1.95 percentage points that was the highest on record.
It's jumbos rates that matter for most of California and other higher priced markets. "

This is another odd spread. The question is whether the problem is the high price or market in which these high priced homes are being sold.