Showing posts with label VIX. Show all posts

Tuesday, May 5, 2009

I am sticking to my story: stocks will chop sideways forever

TO BE NOTED: From Inner Workings:

"
US Credit Protection at “Only” 44 bps May 5th, 2009
By
David Goldman

Now it costs only LIBOR +44 bps to buy credit protection for five years against a default by the United States of America. That’s slightly more than half of the peak level of March, when the prospective collapse of the banking system persuaded the market that the US Treasury and Fed might go down with the banking system.

It’s hard to be angry at Ben Bernanke for diving into the water to rescue the US economy when it seemed to be drowning. The Fed extended nearly $4 trillion of its balance sheet to buy dicey mortgage and credit risks, and kept the financial system afloat. By shoving mortgage money into the banking system it helped established a minimum bid for depreciated houses. On the other hand, it is now joined at the hip to a zombie banking system. That’s why the credit of the United States of America fluctuates with bank stocks, a phenomenon few of us could have imagined only a year ago.

What we have in response is neither a bull market, nor a bear market rally, but exactly the opposite: it is nothing in particular. The US economy has nowhere to go. The Fed will not let the financial system dissolve. It is in too far already. It has to keep throwing good money after bad because the weight of the Fed’s balance sheet will drag it down if the rest of the system goes. But the ever-present demand for savings by aging boomers, the depressant wealth effect, and the zombie character of the financial system all militate against a real recovery.

I am sticking to my story: stocks will chop sideways forever, as I wrote on Jan. 8 when the S&P was exactly where it is now. I didn’t believe the crash, and I don’t believe in the upside. What I expect to continue is the volatility implosion.

I expect VIX to settle down into the high ’20s during the next several weeks. Zombies aren’t volatile.

The collapse of volatility is most noticeable in the most volatile stocks, e.g., Citigroup;

The above chart from ivolatility.com shows the plunge in implied volatility on C by roughly half.

For those unclear about how to trade volatility under these circumstances, this instructional video is recommended."

Wednesday, April 15, 2009

Investors who own stocks should sell options on them using an “overwriting” strategy to increase returns because stock market volatility is elevated

TO BE NOTED: From Bloomberg:

"Use Options ‘Overwriting’ to Boost Yield, Morgan Stanley Says


By Jeff Kearns

April 15 (Bloomberg) -- Investors who own stocks should sell options on them using an “overwriting” strategy to increase returns because stock market volatility is elevated and the rally since March 9 may not last, Morgan Stanley said.

The strategy involves selling call options that become profitable when the underlying shares climb by a fixed amount. A trader owning the position is betting the security won’t rise enough to trigger the option, leaving him with the proceeds of selling the call.

“Overwriting strategies work well when we do not have large and sustained equity rallies,” strategist Sivan Mahadevan wrote in a note. “As a long-term strategy, they have historically offered attractive risk-adjusted returns, but our focus here is more near-term in nature.”

The Chicago Board Options Exchange S&P 500 BuyWrite Index, or BXM, tracks the performance of selling calls a month from expiration once a month using contracts about a month from expiration. The gauge is up 0.2 percent this year before today, while the Standard & Poor’s 500 Index has lost 6.8 percent. The stock benchmark has rallied 24 percent since dipping to a 12- year low on March 9.

“Most investors continue to have little conviction on the direction of stock prices, despite one of the largest one-month rallies in S&P 500 history,” New York-based Mahadevan wrote.

Higher levels of implied volatility, a measure of expected price swings and the key gauge of options prices, mean the yield investors can get from overwriting is “quite appealing by most historic measures,” the strategist said. High volatility lets traders sell calls that are further out of the money and therefore keep more of the gains if stocks rise, he wrote.

Options Benchmark

The VIX, a benchmark for U.S. options prices, has averaged 44.30 this year, more than double the level over its 19-year history. Bigger market swings mean that options can be sold at higher prices because larger moves give contracts better odds of reaching the strike price at which they can be executed.

Calls give the right to buy a security for a certain amount by a given date. Overwriting involves selling options while already owning the underlying security. The strategy is called a “buy-write” when the investor buys stock and sells options at the same time. Both are also known as “covered call” trades.

“This strategy is the most basic and most widely used,” according to the Web site of the Options Industry Council, an investor education group backed by the seven U.S. options exchanges and the Options Clearing Corp. “The covered call is widely regarded as a conservative strategy because it decreases the risk of stock ownership.”

To contact the reporter on this story: Jeff Kearns in New York at jkearns3@bloomberg.net."

Thursday, April 2, 2009

“That is largely reflected in increased risk appetite.”

TO BE NOTED: From Bloomberg:

"Yen Weakens Above 100 per Dollar as G-20 Aid Saps Safety Demand

By Theresa Barraclough and Ron Harui

April 3 (Bloomberg) -- The yen weakened to above 100 per dollar for the first time in five months as the Group of 20 nations pledged to revive economic growth and on speculation the Federal Reserve will step up efforts to counter the U.S. slump.

The yen also fell to a five-month low against the euro and the Australian dollar as stocks rallied, increasing demand for higher-yielding assets. The euro is poised for a weekly gain against the dollar on speculation a European Central Bank official will signal the bank is done cutting interest rates after yesterday lowering them by less than economists expected.

“The market thinks the world is suddenly a better place,” said Sue Trinh, a senior currency strategist at RBC Capital Markets in Sydney. “That is largely reflected in increased risk appetite.”

The yen touched 100.18 per dollar and traded at 99.71 as of 10:55 a.m. in Tokyo, after falling 1 percent yesterday. Japan’s currency weakened to 134.04 per euro, from 133.98 yesterday in New York, when it dropped 2.6 percent, the most in five weeks. The yen is set for a 3.1 percent slide versus the euro this week.

Europe’s single currency traded at $1.3446, up 1.2 percent this week. Australia’s dollar rose to 71.39 yen, after reaching 72.33, the highest since Oct. 21, as a report showed the nation’s services industry shrank last month at a slower pace. The New Zealand dollar advanced to 58.43 yen, after reaching 59.03, the highest since Nov. 10.

Group of 20

The yen weakened against all 16 major currencies this week as world leaders agreed on measures to fight the global recession.

Policy makers from the Group of 20 nations called for stricter limits on hedge funds, executive pay, credit-rating firms and risk-taking by banks. They also tripled the firepower of the International Monetary Fund and offered cash to revive trade to help governments weather the turmoil resulting from the surge in unemployment.

“The G-20 summit could mark a turning point in the global financial crisis,” wrote analysts led by Callum Henderson, global head of foreign-exchange research at Standard Chartered Bank in Singapore, in a note today. “This should be supportive for high-yielding currencies such as the Australian dollar in the near term.”

Asian stocks jumped, with the regional benchmark index headed for its fourth weekly advance, following a rally yesterday in U.S. stocks that pushed the Dow Jones Industrial Average above 8,000 for the first time since Feb. 10.

Further Steps

Japan’s currency fell for a second day versus the greenback on expectations Fed Vice Chairman Donald Kohn may add to measures to revive the world’s second-largest economy, reducing demand for the currency as a shelter from the global crisis. Kohn speaks at 9:10 a.m. in Ohio.

The VIX volatility index, a Chicago Board Options Exchange gauge reflecting expectations for stock price changes that’s used as a measure of risk aversion, fell 0.6 percent yesterday, the third day of declines.

The euro gained against the yen as European policy makers cut the target lending rate by a quarter-percentage point to 1.25 percent, compared with a half-point reduction expected in a Bloomberg survey. Benchmark rates are 0.1 percent in Japan, 0.5 percent in the U.K. and between zero and 0.25 percent in the U.S.

“Interest-rate differentials between the euro zone and other nations such as the U.S. are still favorable for the euro,” said Masanobu Ishikawa, general manager of foreign exchange at Tokyo Forex & Ueda Harlow Ltd., Japan’s largest currency broker. “This makes it easy to buy the euro,” which may rise to $1.3550 and 135.00 yen today, he said.

‘Increasingly Benefit’

ECB President Jean-Claude Trichet indicated at a press conference in Frankfurt following the decision that the economy should “increasingly benefit” from the measures the central bank has taken.

Executive Board Member Lorenzo Bini Smaghi last month said European interest rates are lower than those in the U.S. when making a comparison of real inter-bank lending, adding to the argument against further reductions in the benchmark. He speaks at 11 a.m. in Rome.

Declines in the yen may be limited before a U.S. Labor Department report shows the world’s biggest economy lost more than half a million jobs for a fifth month, reducing the appeal of the greenback.

“There’s a risk of position adjustments before the U.S. labor report, which may prompt buying back of the yen,” said Masafumi Yamamoto, head of foreign-exchange strategy for Japan at Royal Bank of Scotland Group Plc in Tokyo and a former Bank of Japan currency trader.

U.S. Unemployment

U.S. employers probably eliminated 660,000 jobs last month, following a reduction of 651,000 in February, according to the median forecast of 80 economists surveyed by Bloomberg. The Labor Department is scheduled to release the report at 8:30 a.m. in Washington.

The Dollar Index, which the ICE uses to track the greenback against the euro, yen, pound, Canadian dollar, Swiss franc and Swedish krona, decreased 0.1 percent to 84.368, and is poised for a 1 percent weekly decline."

Tuesday, January 27, 2009

A correction would therefore portend the return of risk appetite and improved investor confidence.

From Alphaville, Stacy-Marie Ishmael:

"
Will CDS spreads tumble in February?

Fortis certainly thinks so.

The bank’s analysis, which is based on Didier Sornette’s research into bubbles (think US housing and oil circa 2008), holds that recent increases in CDS spreads in both US and European markets have reached unsustainable levels and are due for a correction - sharpish.

Per the report, by Peter Cauwels, Ken Bastiaensen and Amjed Younis:
Based on our findings, it is likely that the peak for the 4 major indices will be reached between the 2nd and the 12th of February, and as a result they will fall. This is particularly significant since these indices are closely watched as a “fear gauge” for Financial Markets, alongside the VIX Index, Libor-OIS spread and the spread between German bond yields versus other Euro Area government yields.

Their conclusion is based, in part, on the application of the mathematical model of Sornette’s general theory of crashes, which they backtested using the performance of the US dollar weighted average as a data series:

On December 5th, the toolset detected a bubble-like behavior and reported December 10th as most likely crash

Starting on December 9th, the DXY began a consecutive drop of more than 8% until December 17th. This drawdown was the largest since the start of the daily DXY index in 1971and can thus statistically be considered a crash.

In addition to this forward test, a wide range of historical crashes have been analysed and the results used for calibration.

The formula, which according to Fortis represents a so-called “log periodic power law” (LPPL), is given by:

p(t) ≈ A + B(tc - t)-β + C(tc - t)-β cos(ω log(tc - t) +ϕ )

Fortis believes four of the major CDS indices - the iTraxx Crossover and Main, and the CDX High Yield and Investment Grade - which all recently hit record highs, show a ‘bubble-like formation in spreads’, per the graphs below:

Fortis chart of the bubble in the iTraxx MainFortis chart of the bubble in the CDX IG

As for just what a bubble in CDS means:
… in the case of CDS, the spread can be viewed as the cost of buying protection against default and the bubble can be interpreted as a rush to buy protection at ever spiralling prices.

The fundamental picture does add weight to the thesis that the cost of protection could be overvalued. Viewing the implied probabilities as the breakeven levels when buying protection can be useful when assessing the value of CDS protection. For example, the iTraxx Crossover index is a 5Y contract that implies a projected default rate of 60% over the coming 5 years for the constituent companies 16.

The implied probability of default embedded in the spreads is higher than the realised default rate during the worst point in the Great Depression, and is higher than the 15.1% global default rate for speculative grade names projected by Moody’s for 200917. For European speculative grade issuers this is expected to rise to 18.3%. However this figure is not directly applicable to the iTraxx Crossover since the index also includes low investment grade names which normally have a lower default rate.

A correction would therefore portend the return of risk appetite and improved investor confidence.

Mark your calendars, then.

Related link:
Brace yourselves for record corporate defaults in 2009 - FT Alphaville

Here's my reply:

Don the Libertarian Democrat Jan 27 20:34
Since the spreads rose because of the fear and aversion to risk, they will fall when there is a diminution to the fear and aversion to risk. In other words, people will behave differently. What's the point of the math? Are they arguing that when spreads reach a certain point people automatically change their behavior? Or are they saying that,based on a few examples, expect the spreads to go down from here? It has a veneer of science to it, which, it seems to me, allows investors to place some trades feeling awfully damned proud of themselves. If it doesn't work out as planned, they can say that it's just a model. If it does, they can say it worked. In the end, the spreads will go down when investors start sensing a change in sentiment and putting money on it. I agree that's it's likely to be soon, and I base my view on the fact that someone is pitching this model in public. When investors start doing this, they're saying we're ready to ride, so who's with us? It's like a bike race, or drafting in Nascar."

Then Stacy-Marie's reply:

Stacy-Marie Ishmael, FT Jan 27 20:38
FT Alphavillain
Don - actually, and not fully represented here, some of the thinking behind the model fits precisely into that 'drafting in Nascar' paradigm. Here's some more from the note:

"Due to their very nature, financial markets exist of interacting players that are connected in a network structure. These interacting players, often referred to as interacting agents, are continuously influencing each other. In scientific literature it is said that such a system is subject to non-linear dynamics. Modeling such a system in full detail is practically impossible to do. That is why
the long-term behavior of the global economy or the weather is quite hard to predict. Recent research, however, has provided new tools to analyze complex non-linear systems without having to go through the simulation of all underlying interactions. When interacting agents are playing in a hierarchical network structure very specific emerging patterns arise"

(snip snip snip)

"These all fit in the framework of Complexity Economics, which describes the properties that emerge from interacting agents. It has become clear that herding behavior in financial markets results in positive or negative feedback mechanisms causing price accelerations or decelerations and (anti)-bubble formation, where asset prices become detached from the underlying fundamentals"

Then my reply:

Don the Libertarian Democrat Jan 28 01:41
Stacy -Marie,

Thanks. You are the best That's actually what I believe. I use Fisher's Debt-Deflation for what I call a Calling run. My approach comes from philosophy. Specifically, my view of the philosophy of action. Some of what is described fits in with my views about social theories in general, which are drawn from Anthony Giddens work on sociological theory. It does bear some relation to what used to be called Chaos Theory as well. It also helps understand what I call a Proactivity Run, which is what we are in. Businesses are trying to shed jobs before demand actually falls. This is my explanation of why productivity is still increasing for now. Namely, the layoffs are larger than the actual downturn in demand. All of this relates to the negative feedback loop of the fear and aversion to risk in a Calling Run, followed by a Proactivity Run. The next phase is a saving spree. What all these things have in common is panic. In that sense, my view, focused on human agency, is like Shiller's, or any of what we used to call Political Economy theories. I will look into complexity economics. I hope that some of what I said makes sense. What you should clearly understand is how much I appreciate and value your response.
Cheers, Don

Wednesday, January 14, 2009

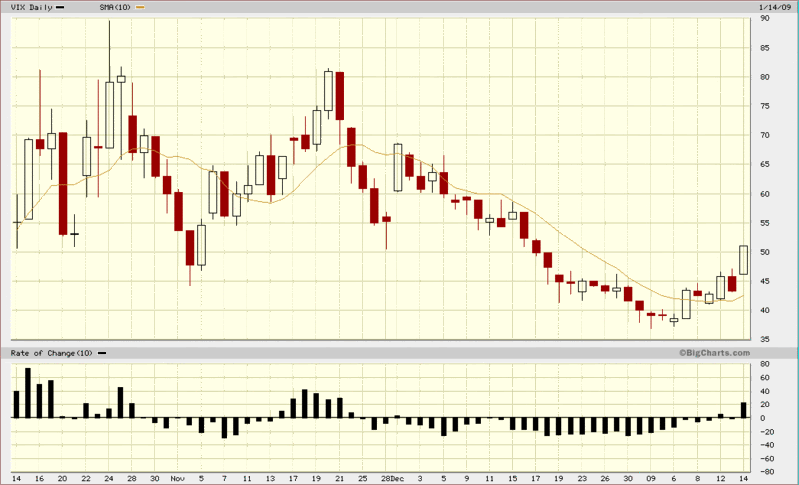
the VIX has spiked all the way to 51.03, up 17.9% so far today and up 32.3% from just six sessions ago.

Since this kind of measure interests me, I can't say that it's good news for the near future. From Trader's Narrative:

"Conference Board Consumer Confidence At New All Time Low

The Present Situation Index of the Consumer Confidence

survey from the Conference Board fell to 29.4:

confidence board consumer confidence present situation Jan 2009

That’s lower than the 2002 bear market bottom. Lower than the confidence level in 1991. Lower than the early 1980’s. Even slightly lower than the darkest days of the 1970’s bear market.

As far as I can tell, the current reading is the lowest that this survey has seen since it was started in the 1960’s!

The Conference Board surveys 5000 US households and their answers to questions about their employment, spending and

From a contrarian perspective this is good news. And this is just another in a long line of extreme pessimism from the average consumer and investor in the US. But from another perspective we need to see at least the start of a change in the doom and gloom before things get better.( I AGREE ABOUT BOTH POINTS )

If you have a really long term view and don’t particularly care about further declines in the short term, then this is a good signal( TRUE ). But if you want to avoid such potential losses then you have to give up trying to anticipate the market’s exact inflection point and wait for confirmation by giving up some gains to the upside."

In my view, the VIX and TED are places that I would look for things to begin to get better, because I believe that the market will begin to get better before the overall economy does. So, let's look at the VIX on VIX And More:

"VIX Tops 50 for First Time Since Mid-December

With the SPX failing to find support at 850 and financials falling another 6% this morning, the VIX has spiked all the way to 51.03, up 17.9% so far today and up 32.3% from just six sessions ago.

Since the large gap down at the open, today’s action has been more of a slow grind than a sharp panic, suggesting that there could be a fair distance still to the down side. SPX support may come in the 820-830 range, but if those levels fail to hold, the possibility of a drop back down to 740 suddenly looms large.

[source: BigCharts]

No good news here, I'm sorry to say. Next week is a big week for me, since I believe that the end of the Bush administration will be greeted with a jolt of new found confidence, once we have been delivered from this plague of incompetence.

Sunday, January 11, 2009

"But the TED spread has declined significantly over the last 6 weeks."

On Econbrowser, some good news from James Hamilton:

"
Signs of a thaw

Yes, I saw the discouraging headlines. But I also see signs of hope in last week's economic news.

Let me begin by acknowledging the awful employment news. This was undeniably grim( BUT IT HAS TO DO WITH THE PROACTIVITY RUN, NOT THE CALLING RUN. ), though popular descriptions that BLS had reported the biggest job loss in any calendar year since 1945 are perhaps unnecessarily alarmist. Population growth would naturally mean that both job gains and job losses would be expected to be bigger absolute numbers than they used to be, and there's no special reason to look at calendar years rather than all 12-month intervals. The graph below shows that in percentage terms, the employment decline so far is similar to what we see in a typical recession.( TRUE )

Year-over-year percentage change in seasonally unadjusted nonfarm payroll employment, from FRED.
nfp_jan_09.png

But my primary concern has not been unemployment per se but instead the dysfunctional financial market that produced it. And here there are some encouraging developments. The TED spread is the difference between the 3-month LIBOR rate (an average of interest rates offered in the London interbank market for 3-month dollar-denominated loans) and the 3-month Treasury bill rate. Its spike up last fall was a very troubling indicator of perceived bank risk, flight to quality, and frictions in the interbank lending market. But the TED spread has declined significantly over the last 6 weeks.( AS HAS THE VIX )

TED spread, as obtained from Bloomberg on Jan 10.
ted_spread_jan_09.jpg

The gap between the A2/P2 and AA rates, which measures how much more riskier (but still prime) nonfinancial commercial firms must pay to borrow compared with safer borrowers, had also reached scary heights and has also come down significantly.( A SIGN OF A DIMINUTION IN THE FEAR AND AVERSION TO RISK. )

Source: Federal Reserve.
a2p2_jan_09.gif

These may be among the developments that persuaded the Federal Reserve it could begin the process of contracting its now enormous balance sheet( A GOOD POINT ). The assets of the Federal Reserve had exploded from $940 billion at the beginning of September to $2.3 trillion by the end of the year, as the Fed expanded operations such as its Term Auction Facility, which offered term loans directly to banks at much more favorable rates than the previously spiking LIBOR, and the commercial paper lending facility, which propped up the commercial paper market with direct purchases. The Fed apparently felt comfortable enough with the current situation to reduce these balances by $126 billion during the week ended January 7. More than half of that reduction came from a reduction in the volume of term auction credit outstanding( GOOD NEWS ).


Federal Reserve assets in billions of dollars. Data source: Federal Reserve Release H.4.1.
fed_assets_jan_09.gif

This reduction in assets was necessarily matched by an equal reduction in liabilities; for details on how this works see my earlier description of the Federal Reserve balance sheet. The primary change last week was a reduction in the Treasury's accounts with the Fed.


Federal Reserve liabilities in billions of dollars. Data source: Federal Reserve Release H.4.1.
fed_liab_jan_09.gif

The TED spread and A2/P2-AA spread have often exhibited a pattern of temporary respite followed by a resurgence of perceived risk, and the same could certainly happen again. Nevertheless, I read the recent numbers as clearly encouraging."

I see both the recent TED and VIX movements as a sign of the diminution of the fear and aversion to risk due to the Calling Run. The Proactivity Run is still going.

Thursday, January 1, 2009

“The GM news was a relief for many investors, who were concerned the government was starting to close the spigot on bailout money,”

I just keep piling these stories up. Here's another case of the market and investors responding positively to Government Intervention. From Bloomberg:

"U.S. Stocks Gain as GMAC Gets Government Money; GM, Ford Rise


By Elizabeth Stanton

Dec. 30 (Bloomberg) -- U.S. stocks climbed the most in two weeks after the government widened its efforts( GET THAT? ) to keep General Motors Corp. out of bankruptcy by shoring up its finance arm.

GM rallied 5.6 percent as the U.S. Treasury committed $6 billion to support GMAC LLC. Smaller rival Ford Motor Co. jumped 3.2 percent. Rohm & Haas Co. gained 12 percent on speculation Dow Chemical Co. will be forced to complete its acquisition of the maker of paint and coatings. All 10 industry groups in the Standard & Poor’s 500 Index advanced more than 1 percent, sending the benchmark gauge to its highest close since Dec. 17.

“The GM news was a relief for many investors, who were concerned the government was starting to close the spigot on bailout money( CAN YOU UNDERSTAND THIS? ),” said Steven Neimeth, who manages $600 million at SunAmerica Asset Management in Jersey City, New Jersey.

The S&P 500 increased 2.4 percent to 890.64 for its steepest gain since Dec. 16. The Dow Jones Industrial Average rose 184.46 points, or 2.2 percent, to 8,668.39. The Russell 2000 Index of small companies added 3.6 percent.

The S&P 500 has plunged 39 percent in 2008, poised for its worst year since 1931, as the most severe financial crisis since the Great Depression dragged the U.S., Europe and Japan into the first simultaneous recessions since World War II. At its lowest closing level of 2008 on Nov. 20, the S&P 500 was down almost 49 percent for the year and almost 52 percent from its Oct. 9, 2007, record.

VIX Retreats

The benchmark index for U.S. stock options fell to an almost three-month low as the cost of insurance against declines in the S&P 500 decreased. The VIX, as the Chicago Board Options Exchange Volatility Index is known, slid 5.2 percent to 41.63. About 7.3 billion shares changed hands on all U.S. exchanges, 28 percent fewer than the three-month daily average. Markets will be closed on Jan. 1 for the New Year’s holiday.

U.S. stocks fell yesterday, ending the first two-day rally in three weeks, after funding for Dow Chemical’s purchase of Rohm & Haas fell through.

GM shares jumped 20 cents to $3.80. The U.S. Treasury yesterday said it will purchase a $5 billion stake in GMAC and lend $1 billion to GM so the automaker can contribute to the financing arm’s reorganization as a bank holding company.

The loan is in addition to $13.4 billion the Treasury agreed earlier this month to lend to GM and Chrysler LLC.

Ford, the nation’s second-largest automaker, added 7 cents to $2.29.

‘Ready to Move’

“There are signs( DIMINUTION OF FEAR AND AVERSION TO RISK ) that equity markets might be ready to move,” Gary Anderson, manager of the $2.7 billion UMB Scout International Fund, told Bloomberg Television. The fund has outperformed 93 percent of its peers this year. “Certainly the massive amount of liquidity that central banks are creating around the world is going to find a home( TRUE ).”

Rohm & Haas, which slid 16 percent yesterday after Dow Chemical lost access to $9 billion in cash to fund the acquisition, added $6.36 to $59.70 today. Credit Suisse AG analyst John McNulty said Dow may have a “tough time” pulling out of its plan to buy Rohm & Haas after credit-ratings cuts raised the cost of the takeover. The agreement “leaves little room for Dow to walk away,” McNulty wrote in a note to clients.

Iron Mountain Inc. rose 13 percent to $22.49, its biggest gain in two months. The world’s largest seller of records- management services will replace UST Inc. in the S&P 500. Altria Group Inc. is in the process of buying UST, a Stamford, Connecticut-based snuff producer.

Apple Slips

Apple Inc., the maker of Macintosh computers, iPod music players and the iPhone, went from $87.90 at 12:47 p.m. New York time to $84.72 at 12:55 after Gizmodo, a Web site, published a report that said the health of Apple Chief Executive Officer Steve Jobs is “rapidly declining.” Apple declined to comment on the report about Jobs, who is a cancer survivor. The shares recovered to $86.29, a 0.4 percent drop.

Europe’s Dow Jones Stoxx 600 Index rose 1.8 percent as gains by carmakers helped trim the index’s 2008 slide to 46 percent, the worst annual decline on record for the regional benchmark. The MSCI Asia Pacific Index climbed 0.6 percent.

U.S. stocks advanced even as a gauge of consumer confidence dropped to a record low and a measure of business activity remained near a 26-year low. The Conference Board’s index of consumer confidence fell to 38 from 44.7 in November, the New York-based private research group said today. The group started keeping records in 1967.

The Institute for Supply Management-Chicago’s business index increased( GOOD ) to 34.1 this month from 33.8 in November. The gauge has been below 50, the dividing line between growth and contraction, all but four months this year.

Retail Slump

U.S. retailers’ sales declined last week the most in almost six years as steeper markdowns before and after Christmas failed to salvage what may be the worst holiday shopping season in four decades. Sales at stores open at least a year fell 1.8 percent in the seven days through Dec. 27, the International Council of Shopping Centers and Goldman Sachs Group Inc. said. Holiday comparable-store sales may decline as much as 2 percent, according to the New York-based trade group.

Home prices in 20 U.S. cities plunged at the fastest rate on record, depressed by mounting foreclosures and slumping sales. The S&P/Case-Shiller index tumbled 18 percent in the 12 months to October, more than forecast, after dropping 17.4 percent in September. The gauge has fallen every month since January 2007, and year-over-year records began in 2001.

‘Washout’

“We have had a washout in terms of asset prices around the world in the past year,” Michael Holland, who oversees more than $4 billion as chairman and founder of Holland & Co. in New York, told Bloomberg Television. “Is it possible we could get more negative surprises which knock things down even more in 2009? Sure, but that’s not a good bet( I AGREE ).”

Earnings of companies in the S&P 500 have decreased from the year-earlier period in each of the past five quarters, matching the longest streaks of declines on record, and the slump is forecast to continue. According to estimates compiled by Bloomberg, earnings from continuing operations will fall 12 percent in the fourth quarter from a year earlier, 10 percent in the first quarter, and 5.8 percent in the second quarter.

Alcoa Inc., the largest U.S. aluminum producer, is scheduled to report fourth-quarter results Jan. 12, the first Dow average company to do so."

Another obvious point about the importance to investors and the markets to government bailouts. Focus on the people will the money, and you'll understand how our system really works.

"The last time the VIX was below 40.00 was on October 2, 2008"

Some good news on the diminution of the fear and aversion to risk from VIX And More:

"
Wednesday, December 31, 2008

VIX Drops Below 40

The last time the VIX was below 40.00 was on October 2, 2008

0 comments "

Tuesday, December 30, 2008

"the VIX futures continue to reflect expectations of a rising VIX over the course of at least the next 2-3 months"

From Vix And More:

"
Tuesday, December 30, 2008

VIX Close of 41.63 Is Lowest in Three Months

The last time the VIX closed below 42.00 was way back on October 1st, when the VIX closed at 39.81.

Before anyone gets excited about the possibility of the VIX back in the 30s, I should note that the VIX futures continue to reflect expectations of a rising VIX over the course of at least the next 2-3 months. Today’s VIX January futures settled at 44.18 and the February futures settled at 45.08. Futures for August through October are now priced in the 37-38 range, however, suggesting that volatility expectations are being lowered for the second half of 2009.

I still think that it signals a diminution of the fear and aversion to risk.

Monday, December 29, 2008

"At that time, the markets were just in the process of putting in a post-March top."

From VIX And More:

"ISEE Equity Call to Put Ratio at Highest Level in 16 Weeks

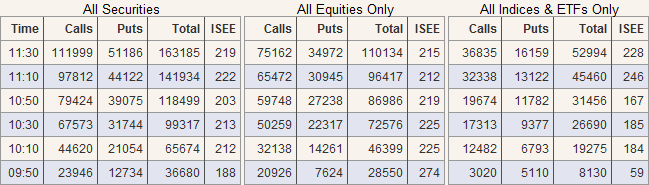
The ISEE equity call to put ratio hit a 16 week high of 189 on Friday, as investors showed a strong preference for calls over puts. Today that ratio is even higher, at 215 as of 11:30 a.m. ET.

Trading is light so far and extreme values in the ISEE have a tendency to revert to the mean (146) as the day wears on, but coming on the heels of Friday’s high number, I believe the ISEE numbers should bear watching throughout the day.

For the record, the last time the ISEE equity call to put ratio was over 200 in a single session was back in the middle of May. At that time, the markets were just in the process of putting in a post-March top.

[source: International Securities Exchange]

What It Is:
The Put/Call ratio is a popular sentiment indicator. These types of indicators attempt to gauge the prevailing level of bullishness or bearishness in the market. Typically, sentiment indicators are used as contrarian tools. In other words, when market participants are most bullish, the likelihood of a downside reversal is greatest. And when investors become overly bearish, a market rally may be on the horizon.

How It Works:

There are several Put/Call ratios in use. The one that many investors rely on is based on data collected by the Chicago Board Options Exchange (CBOE). Each day, the CBOE adds together all of the call and put options that are traded on all individual equities, as well as indices like the OEX, or S&P 100. Purchasing a call option, you'll remember, simply amounts to a bet that a particular a stock or index will rise in value. By contrast, a put buyer is anticipating that an underlying stock or index is poised to fall.

Each day the CBOE calculates the ratio below:

Volume of put option contracts / Volume of call option contracts

On days when the major averages perform strongly, the number of calls bought typically far outweighs the number of puts. On these days, greed prevails and the put/call ratio may be very low -- perhaps in the neighborhood of 0.70. On days of deep market weakness, however, fear prevails and the number of puts purchased is generally far greater than calls -- possibly reaching 1.10. While 1.0 might seem to be a neutral reading, there are more calls than puts bought on an "average" day. As such, a reading of around 0.80 is about "normal" on this indicator.

The daily put/call line, when plotted on a graph, is very erratic. To make the graph easier to read, most charting packages allow you to plot a moving average to smooth out the raw data. Common moving average periods are 10 and 21 days.

Why It Matters:
The put/call ratio works well in conjunction with overbought/oversold indicators such as the Arms Index and McClellan Oscillator. When you begin to see consistently extreme readings across several different measures, it is a good sign that a market reversal may be on the horizon. Traders should recognize these signals and incorporate them into their trading tool kit. Using the Put/Call ratio as a contrary tool can help you avoid getting swept up in the prevailing sentiment, which often leads to buying when the market is high and selling when it is low."

Back to VIX And More:

The International Securities Exchange (ISE), which publishes a superb implied volatility chart that I have featured on VIX and More on a number of occasions, has recently launched an enhanced version of their IV chart. The new version of this chart, which I have appended below, adds an “ISEE value” to the list of data. I have discussed the ISEE call to put ratio frequently in this space in the past. In this incarnation it is simply a ratio of call volume to put volume for the specified security."

From Trading Markets:

"Technicians have long used put/call ratios as a method of assessing market sentiment. Conventional wisdom issues a contrarian signal when an apparent imbalance occurs between the trading volume of calls versus puts.

The logic from the wise-guy camp states that excessive volume in either calls or puts highlights extreme levels of bullish or bearish conviction. Excessive bullishness often foreshadows an overbought market condition. If too few buyers are left on the sidelines then long liquidation or short selling will force the market to auction lower without usual levels of support.

Traditionally the most popular put/call ratio was derived from volume on the Chicago Board of Options Exchange (CBOE). The CBOE p/c's are listed on their web site with the ratios recalculated throughout the session. Several years of daily put/call data is readily available at www.cboe.com. The formula for the classical put/call ratio is simply volume of calls divided by volume of puts. The higher the value of the ratio the larger the number of traded puts versus traded calls.

Because calls are typically traded by investors in larger numbers than puts, a normal p/c ratio in equities would be around .70 or lower. Due to portfolio insurance, index traders tend to favor puts to a greater degree than calls. A p/c ratio among index products is usually around 1.4 or better. Combining the volume of stock options together with index options creates an all product p/c with a benchmark of 1.0 an accepted norm.

The importance of Options Traders' personalities

The simplistic math deriving the vintage put/call ratio tells us too little about the character of options participants.

For starters a single trade of massive proportions can mislead us by unduly influencing volume. For example a market maker may trade a large delta neutral spread put spread that at naked glance makes the puts look far more active than they really were.

If 1000 traders each buy a single call option while one large market maker or broker/dealer buys 1000 puts then the p/c would be an exact 1.0. Those one thousand small traders buying calls tells us a great deal though about the bullish sentiment of retail traders.

In p/c terms, their over-hyped activity would be negated by that lone large put trade. Also, volume alone doesn't tell us whether retail traders are buying options in anticipation of a move higher or if those traders are selling options that they had purchased earlier. Certainly we could track open interest for clues but once again we have no idea if changes in OI are reflective of mass activity or just a big order or two.

The ISEE index

In response to some of these pitfalls the International Securities Exchange (ISE) publishes their own modified version of the put/call ratio called the ISEE index.

Unlike the old school p/c ratio the ISEE filters out trades from both market makers and broker/dealers. The ISEE further differentiates itself by using only opening long trades in it's tabulations.

As such the ISEE presents a much clearer picture of how retail options traders are positioned. The ISEE also uses a different equation than the regular p/c in calculating their index. To formulate the ISEE, the exchange takes the modified call volume, divides it by the put side and then multiplies the result by 100. Hence the ISEE is always a whole number.

With a normalized p/c equation a higher reading symbolizes greater put activity to calls while the ISEE formula generates higher readings if call buyers outweigh put buyers. So while a traditional p/c ratio of .75 would mean more puts than calls an ISEE value of 75 is the exact opposite. Like the CBOE the ISE also offers updated calculations of their p/c index several times an hour.

We can use the ISEE as a Trading Tool. Below is a chart plotting ISEE values over the past year. We'll smooth variance by including a 10 day moving average.

Now let's compare our ISEE chart to that of the S&P 500 index.

As you can see, analysis of the ISE index is highly discretionary. On one hand we know that at some point zealous options buying will signal a turn in prices. One can readily observe how 2007's highs in both July and October were achieved at the same time call buying was at relative extremes. We also note gigantic levels of put activity coinciding with important spike lows in August, January and April.

On the other hand it's also clear that trends are fueled by traders positioning themselves via options. Notice how our 10 day MA of the ISEE has a tremendous correlation to the SPX. Thus we have a typical trading paradox. Markets can't rise without buyers; yet markets can't become overbought without too much buying. This is where art comes into play.

Fading perceived sentiment extremes is not a holy grail. For years I've tabulated football picks against the spread from as many as 100 prognosticators each week. If I see more than 75% of the sample picking the same team I bet the other way.

While my betting results are better than average there is a great deal of streakiness. Last season for example bookmakers suffered their largest losses in years as favorites kept on winning. One of America's top handicappers, Dave Tully of the Daily Racing Form, said not only did Vegas casinos get creamed on single game wagers but even traditional sucker bets like parlay cards were paying off big for retail bettors.

We saw the same phenomenon in the ISEE in the first two weeks this past January. Put buyers were in force while the market was plummeting over 15%. There can be periods when the public is quite right. But not for keeps.

Sentiment through observance of put/call ratios is one of my major tools. I monitor every conceivable sentiment indicator. In future articles we'll touch upon some practical usages of how to profitably combine sentiment with support and resistance.

Kurt J. Eckhardt has been trading since 1982 when he began his career as an active floor trader in the CBOT Treasury Bond pit. Kurt is President of Eckhardt Research and Trading and its subsidiary Agility Trading. Agility offers both individuals and funds cutting edge technical strategies along with high performance instruction. For more information go to www.agilitytrading.com or email Kurt at kurt@agilitytrading.com."

Now, from the ISE:

"ISEE Index
The ISE Sentiment Index is a unique put/call value that only uses opening long customer transactions to calculate bullish/bearish market direction. Opening long transactions are thought to best represent market sentiment because investors often buy call and put options to express their actual market view of a particular stock. Market maker and firm trades, which are excluded, are not considered representative of true market sentiment due to their specialized nature. As such, the ISEE calculation method allows for a more accurate measure of true investor sentiment than traditional put/call ratios.
Because of this distinctive calculation methodology, ISEE has been referenced by The Wall Street Journal, Barron’s and other leading publications as a useful investment tool. Investors and investment professionals can use this unique put/call value to determine how other investors view stock prices, as well as to supplement and validate their own market views.
ISEE is free. To receive the end-of-day email, sign up for the ISEE Alert email.
In the News
Now from Nick Perry:

"In a post that went up in November - My Mae Culpa - Not Paying More Attention to Optimism - I recounted my sins in terms of not paying attention to data and changing environments. Not wanting to repeat that same inattentive error, I have been running through some indicators to go along with yesterday's post - Percent of ETFs Near Oversold Levels Hitting Extreme Reading. This search took me back to the "All Equities Only" ratio of the ISE Sentiment Index (ISEE), which closed at 92 yesterday.

Readings below 100 are fairly uncommon and suggest skepticism, as this is a "call/put" ratio. (You can find the chart of the data here.) To put this in perspective I created the chart below which marks a blue diamond on days when the All Equities reading was below 100. There was a cluster of signals during the early part of the rally that began in mid-2006, but the rest appear to mark short-term bottoms.

The mistake I made in October was not paying attention to the change in the trend of the price action. Committing that "same" mistake again would mean ignoring strength if we do see a bounce.

<
-posted by Nick Perry on 1/10/2008 1:07 PM"

I guess we're going down in the short run.

Friday, December 26, 2008

"certainly cannot claim full responsibility for the drop in 10 day HV from 89 to 35."

From Vix And More, a post I see as good news:

"SPX Ten Day Historical Volatility at Lowest Level Since September 12( LEHMAN )

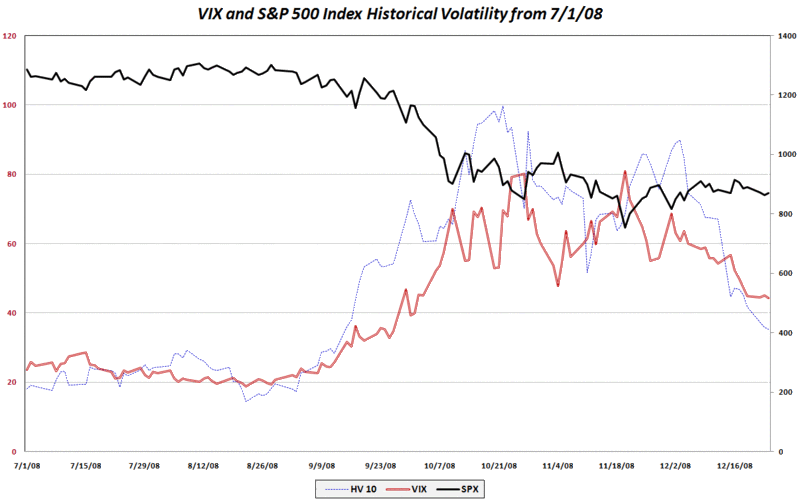
There are quite a few ways in which to measure historical volatility. Probably the most responsive of the time periods commonly measured is the 10 day historical volatility (HV) period, which covers the last 10 trading days. Variously referred to as statistical volatility, realized volatility, actual volatility, etc., the 10 day historical volatility measure for the SPX (dotted blue line in chart below) peaked on October 22nd at just a fraction under the 100 level. On December 3rd the 10 day HV was still holding strong at 89, but it has fallen precipitously over the course of the last three weeks and is down to just 35 as of Wednesday’s close and on target to dip as low as 33 or so today.

For comparison purposes, the 10 day HV in the SPX has not been below 35 since September 12th, just prior to the Lehman bankruptcy.( AS YOU KNOW, I BELIEVE THAT THIS BEGAN THE FLIGHT TO SAFETY )

The bottom line: while a VIX in the low 40s may look cheap at the moment, consider that the recent historical volatility in the SPX has been slightly more than three quarters of that represented by the VIX. Of course, the December holiday effect has artificially depressed volatility to some extent, but certainly cannot claim full responsibility for the drop in 10 day HV from 89 to 35. ( I TAKE THIS AS A SIGN THAT THERE HAS BEEN A DROP IN THE FEAR AND AVERSION TO RISK IN SOME INVESTORS )

[source: VIX and More]

Friday, December 19, 2008

"The volatility bubble that we spoke of just last week is starting to unwind pretty fast, with the VIX now down more than 50% from its highs."

Interesting graph from Bespoke. I say that this is good news:

"
VIX Sliding Fast

The volatility bubble that we spoke of just last week is starting to unwind pretty fast, with the VIX now down more than 50% from its highs. The VIX has typically gone up when the market has gone down, but even on days when the market has declined this week, the VIX has gone down as well. As shown below, the VIX recently broke below its November lows and is currently resting just above 40. There isn't much support in sight until the mid-30s.

Vix1219

Subscribe to Bespoke Premium to receive more in-depth research from Bespoke.

Thursday, December 18, 2008

"He estimates that such a shock causes a sharp contraction for two quarters, which is then followed by abnormally high growth. "

Another interesting post on the FT:

"
Normality is just a few policy steps away

December 18, 2008

By Ricardo Caballero

Economic agents of all sorts, from creditors to consumers, are frozen waiting for some sense of normality to be restored amid the financial crisis. However, normality is much closer —just a few bold policy steps away— than is the conventional wisdom. ( I AGREE )

The system we had before the crisis is not permanently broken, but it needs to be made more resilient to aggregate shocks, especially panic-driven ones. ( I AGREE )

I build my analysis and policy prescription on three premises and observations.

First, before the crisis the world economy had an excess demand for assets, especially AAA assets, and this will not change significantly once the crisis ends. ( FINE )

Second, and contrary to what investors thought at the peak of the boom, the (private) financial sector in the US is not able to satisfy this demand for AAA assets when large negative aggregate events take place. ( OK )

However, the US government does have the capacity to fill this gap, especially because it is the recipient of flight-to-quality capital, even when the core of the global financial crisis is located in the US. ( TRUE )

Third (and with the benefit of hindsight), the main policy mistakes were made during rather than before the crisis. ( DON'T AGREE )

These observations hint at a policy framework for the crisis and the medium run. For the latter, we can go back to a world not too different from the one we had before the crisis (real estate prices and construction sectors aside), as long as the government becomes the explicit insurer for generalised panic-risk. ( ISN'T THAT WHAT WE HAVE? )

That is, while monolines and other financial institutions can lever, their capital for the purpose of insuring microeconomic risk and moderate aggregate shocks, they cannot be the ones absorbing extreme, panic-driven, aggregate shocks. This must be acknowledged in advance, and paid for by the insured institutions. ( OK )

Reasonable concerns about transparency, complexity, and incentives can be built into the insurance premia. Collective deleverage, as being done, should not constitute the core response; macroeconomic insurance should. ( OK )

The structural policy framework for the medium run also carries over to the crisis-policy itself. The essence of a solid recovery should build not from deleveraging and a forced brutal contraction of the financial sector ( I'D LIKE TO AVOID THIS ), but from the explicit and systemic insurance provision against further negative aggregate shocks to their balance sheets caused by panic or predatory actions. ( I STILL SAY THAT WE HAVE THAT )

The recent intervention of Citi, with a mixture of (paid) insurance and capital, is promising, and so is the second intervention of AIG (see the recent FT-forum articles by Caballero and Krishnamurthy, and Kotlikoff and Merheling for similar assessments). ( HOW'S THAT? )

These interventions need to be scaled up to the whole financial system (banks and beyond), and it is better to do it all at once, for in this case the likelihood of the government ever having to disburse funds for its insurance provision becomes negligible. ( WE HAVE THAT )

The good side of panic-driven contractions (as opposed to those driven by more structural factors) is that the potential for a strong recovery is always around the corner. ( TRUE )

Although the current crisis has already caused enough collateral damage to add persistence to the recession, there are still plenty of resources waiting on the side to make a sharp rebound possible. ( I AGREE )

I do not mean to say that this recession is an imaginary one. On the contrary, I believe it is a very serious recession. My point is simply that good policy has an opportunity to bring the recession back to familiar turf by defeating the extra gloom ( I AGREE ), and if this happens, the recession will become a manageable one from which current asset prices, on average, will look like once-in-a-lifetime deals ( I AGREE ).

Along the ideal recovery path described earlier, the real interest rate would remain at record low levels for a long time; risk-spreads and the VIX index (the Chicago Board Options Exchange Volatility Index, known as Wall Street’s “fear gauge”,) would decline gradually but consistently; asset prices and financial leverage would rise rapidly; the yen and dollar would depreciate vis-á-vis most other currencies, helping net exports in Japan and the US; commodity prices would recover but not to record levels. ( SOUNDS GOOD )

In addition, non-residential investment, inventory accumulation, and durable expenditures would snap back, joining and leveraging on the fiscal and monetary expansions; global imbalances would stabilise and build back a bit; unemployment would peak at single digit levels and then begin to turn around; and inflation would rise only gradually in the developed world, creating the needed space for a recovery consolidation. ( WOULD WORLD PEACE ENSUE AS WELL? )

There is no way out of a dreadful last quarter of 2008 and well into the first quarter of 2009. But the big difference with the consensus forecast is in the sharp recovery after that. ( I AGREE )

The source of this difference is in the assessment of the dominant nature of the recession. Slow recoveries follow the typical credit crunch, as financial resources have to rebuild for growth to resume.

But while I think this was the nature of the mild recession preceding the events at stricken insurer AIG, and Lehman, the collapsed investment bank, the dominant recession now is very different in nature. ( I AGREE )

It is a systemic run on all forms of explicit and implicit insurance contracts ( THAT'S IT ), but with no shortage of resources on the side. If confidence recovers, the resources to support the recovery are abundant and ready ( I AGREE ).

Nick Bloom, assistant professor of economics at Stanford University, provides the best available evidence of how an economy is likely to react to a temporary bout of volatility.

He estimates that such a shock causes a sharp contraction for two quarters, which is then followed by abnormally high growth. I think this is the correct way to view the current recession, as long as bold policy actions are undertaken. ( OK )

Of course many things can go wrong to cause a disastrous outcome, but enough has been written about these negative scenarios. It is time to, at the very least, begin to sketch what the good scenarios may look like.

I believe that we Implicitly have the guarantees he's asking for.

Tuesday, October 28, 2008

Here Comes The VIX, Here Comes The VIX

Gillian Tett in the FT:

"A couple of years ago – or before banks started to go bust – economists sometimes liked to talk about a phenomenon they christened The Great Moderation.

This was the idea that the 21st-century financial system and global economy had become so stable and sophisticated that dramatic swings in activity had seemingly disappeared. Volatility, in other words, was supposed to be an issue of the past.

These days a new phrase is needed to describe these Not-So-Moderate-After-All times (the Great Panic, perhaps?). On Friday, the Chicago Board Options Exchange Volatility Index, the Vix, rocketed 32.1 per cent to 89.53, as equity markets suffered another dramatic sell-off. The gyrations of the yen, euro, sterling and dollar have also been wild, pushing levels of currency volatility to heights barely seen in decades."

So let's:

1) Retire the phrase " The Great Moderation", and welcome in "The Great Volatility".
2) Add the Vix to our derivative plays.
3) Find risk-taking investors.
4) Retire the VAR ( Value at risk ) model for hedge funds. Too optimistic on the way up, too pessimistic on the way down. They appear here to be akin to laws.
5) Hope the policy-maker's prayers for hedge funds health works.

Anyway, read her whole post, since a couple of the suggestions are mine.

However, here we meet again our irrational and overly timid investor:

"On one level the absence of scavengers might seem “irrational”, given that plenty of cash-rich institutions still exist. On another level it makes perfect sense, given how shell-shocked many institutions now seem – and the sheer difficulty of predicting what other disorientated investors might do next."

He's turning up quite a bit.