Showing posts with label Proactivity Run. Show all posts

Friday, May 29, 2009

as the pain of the recession spreads from consumers to businesses in the face of eroding global demand.

TO BE NOTED: From Alphaville:

"
US economy contracts by 5.7% in Q1

From the FT:

The US economy continued to contract in the first quarter of this year as the pain of the recession spreads from consumers to businesses in the face of eroding global demand.

Revised commerce department figures showed on Friday that US gross domestic product declined by an annualised rate of 5.7 per cent in the first three months of the year, compared with last month’s estimate of 6.1 per cent.
The decline was less severe than original projections due to slower liquidation of inventories and the narrowing trade gap.

Economists had been expecting the revised decline to be 5.5 per cent, so it’s still a bit of a mixed result.

Market reaction: Dow up 11 points, or 0.14 per cent. Treasury yields down fractionally per cent. Yawn.

Related link:
US GDP press release - Bureau of Economic Analysis

Sunday, May 17, 2009

To us, that week, it looked very much like a run on the entire financial system

TO BE NOTED:

Sunday, May 17, 2009

How TARP Began: An Exclusive Inside View

May 14, 2009 04:01 PM ET | Rick Newman | Permanent Link | Print

When it first came into existence last September, TARP—the troubled assets relief program—sounded like just another ungainly government acronym. But since then, it has become an integral—and controversial—part of America's recession economy.

TARP's chief architect was Henry "Hank" Paulson, President Bush's treasury secretary, who led the financial rescue along with Federal Reserve Chairman Ben Bernanke and New York Fed Chairman Tim Geithner, who's now Paulson's replacement at treasury. Their initial plan was to use the $700 billion in TARP funding approved by Congress last October to purge financial firms of their so-called toxic assets.

[See why the banks still aren't fixed.]

But TARP morphed into an über-bailout that included direct cash injections into banks, the auto rescue, the AIG intervention, and other government efforts to revive the economy. If it sounds like a trial-and-error experiment, well, that's how it felt to the policymakers who designed it, too. "When we looked for easy solutions, we kept coming up empty," says David Nason, who was a senior Treasury Department official during the Bush administration. "Hank used to say all the time, 'We're going to have to do this with duct tape and fishing wire.' "

Nason and some of his Treasury colleagues did much of the jury-rigging, running doomsday scenarios, negotiating emergency deals with banks, wooing incredulous members of Congress, and devising ways to deal with problems once considered unthinkable. Frustrated Treasury Department officials, for instance, foresaw much of the carnage but found themselves poorly equipped to stop it. Anxious finance ministers from around the world began calling Treasury last summer to find out what the government planned to do about the developing crisis. The most tense moment may have been the September failure of Lehman Brothers, which occurred with alarming speed after British financial regulators scotched a takeover bid by the British bank Barclays.

[See 6 surprises from the recent bank stress tests.]

Nason and two other former Treasury officials, Philip Swagel and Kevin Fromer, spoke recently at a panel discussion sponsored by the Milken Institute. Their remarks form one of the most thorough accounts to date of how the government struggled to contain the worst financial crisis since the Great Depression. (See a video of the full discussion, which I moderated.) Here's a condensed version of their remarks:

David Nason, former assistant treasury secretary for financial institutions: The first inflection point was March 16, 2008, which was the acquisition date by JPMorgan Chase of Bear Stearns. The sheer time it took for this institution to go from viable to nonviable was breathtaking. Just two days before, the regulator [the Securities and Exchange Commission] had said Bear had adequate liquidity of $8 billion. This is an important inflection point because it was the first time the government had stood up and said we are going to support nonbanking institutions. We knew at that point the times had changed. We knew the policy ramifications were going to be very difficult and far reaching.

[See 5 signs the bailouts are getting better.]

We worried most significantly about the consequences of other similarly situated firms. It was a very trying and stressful time because when we looked for easy solutions, we kept coming up empty. The government did not have a ready-access pool of money to support or manage the resolution of financial institutions. The political climate was very challenging—at the time, people saw this as a bailout for fat cats on Wall Street. And there was some jurisdictional squabbling in Washington.

Philip Swagel, former assistant treasury secretary for economic policy: Right after Bear failed, the economy looked like it was actually in pretty good shape considering the problems in housing and the financial sector. Overall growth was positive, driven especially by exports. In the wake of Bear's failure, we looked at options, including many things that are now familiar: buying assets, insuring assets, buying pieces of pieces of institutions, in other words injecting capital, and a massive bailout from the bottom from refinancing every troubled homeowner. And we said those are all things you could write down, but back then, you had rebate checks that had been enacted but weren't yet going out, and we had positive growth. It would have been hard to imagine getting the authority to do those things or the approval from Congress for a contingency fund in case things got worse.

Nason: The next inflection point was July 2008. The government was worried about the big investment banks, CDS [credit-default-swap] spreads were blowing out, we were also worried about Fannie Mae and Freddie Mac. These were some of the most leveraged institutions on Earth. Together, they had over $5 trillion in exposure if you consider the guarantee obligations that they had. Match that against about $60 billion in capital. We were also concerned that the housing correction was turning out to be significantly worse than the GSEs [government-sponsored enterprises, such as Fannie and Freddie] expected. We were very concerned that the GSEs were being overly optimistic about their ability to manage risk and withstand future losses.

[See the best and worst bailed-out banks.]

The GSE equity prices were getting punished during this time. More important to us, however, was the debt market. It was very clear to us there's no way the U.S. financial system is going to allow a firm the size of Fannie Mae to collapse( NB DON ). We were very worried about the trillions in debt they had outstanding, and what it would do to confidence if we let that debt go.

At this time, the Treasury was getting calls from finance ministers' offices from different parts of the world inquiring, "What is the government's relationship with Fannie Mae and Freddie Mac?" It's odd, but this appeared to be the first time that people were focusing on the fact that these are quasi-governmental institutions.

During this time period, the home loan banks, another GSE with similar exposure to the housing market, decided to postpone an auction. Every auction was something that we focused on and were worried about.

[See the banks most likely to pay back their bailout funds.]

We made the decision based on this set of circumstances that we had to support the GSEs. How were we going to do that? What did we have in our toolbox? Essentially nothing. We had about $2 billion of backup credit support for the GSEs. For $1.4 trillion organizations. This was clearly not enough to support these institutions in any real way. And we had no ability to provide any kind of equity support at all. So we decided we had to go up to Congress, bite the bullet, and ask for authority to backstop these institutions.

On July 30, 2008, the president signed a bill into law to provide equity support to these institutions. And we had the ability to support their debt up to the federal debt limit.

We made the judgment not to request the authority to nationalize the GSEs. It would have muddied the political discussion. I'm not sure we would have gotten the authority, and at this time, there wasn't a pressing need to do so. There's a long, tortured story about how the GSEs and Washington interface. But we wanted to have broad authority to support the GSEs and prevent their collapse.

[See why the auto bailout is a good model for other struggling firms.]

The entire month of September was an inflection point under my definition. But the first inflection point associated with September is Sept. 7, 2008, when the GSEs were forced into conservatorship. That came after regulators determined that they were drastically undercapitalized.

Two days later, AIG's stock fell 19 percent. Lehman's discussions to sell itself to the Korean Development Bank failed. The next day, Lehman put itself on the market for sale, with no clear takers. After some very tense discussions about whether there would be a purchaser, like JPMorgan was for Bear Stearns, we were very distressed to know that there were no takers.

So from the 10th to the 14th, the Federal Reserve, with the Treasury's support, decided to flush the system with liquidity. The Federal Reserve expanded the level of collateral the primary dealer credit facility would take, they increased the collateral that the term securities lending facility could take, and they increased the ability of banks to support nonbanking institutions. The government was putting "foam on the runway" to try to deal with what we were afraid of, which was how the market would react to a Lehman Brothers bankruptcy.

The next day, Lehman Brothers filed for bankruptcy.

The question is: Did we let Lehman Brothers fail? That assumes it was a choice that we made. The simple truth is that the government was presented with an institution with a $600 billion balance sheet, with enormous leverage. Confidence in the institution was virtually nonexistent. The only way to stabilize a firm under these circumstances is to stop a run on the institution, stop counterparties from claiming their debts should immediately come due. That was manageable in the Bear Stearns situation because someone was willing to guarantee all or most of those liabilities.

[See how bailouts can butcher capitalism.]

The public posture was that government support would not be available. But there wasn't a single credible buyer at the table who was turned away by us.

So when people ask, "Why did you let Lehman Brothers fail?" I ask, "What is the deal that the government turned down that would have prevented Lehman's failure?" If there's not someone willing to take on a balance sheet as large as that of Lehman Brothers, what is the government to do? The government has a few options: We have a lending facility at the Fed, you could provide a loan to them secured against collateral, or you could guarantee all their liabilities. That might have been the right decision, but we had no authority to do that before TARP.( NB DON )

Looking back, if we could have plugged some of the holes in our authorities, maybe this could have been done differently. I don't think we would have gotten those authorities if we had asked for them before September.

[See why the feds rescue banks, not homeowners.]

Of course, things continued to be unpredictable. We didn't predict that the U.K. bankruptcy process would essentially destroy all confidence in that funding model and that business model. And we didn't expect that the commercial paper market would essentially shut down because Lehman Brothers' commercial paper was impaired. Those two markets were the transmission vehicles that killed confidence, which we didn't expect.

That same day as Lehman, Bank of America acquired Merrill Lynch. We didn't have a second to catch our breath. The day after the Lehman bankruptcy, AIG got a $50 billion loan from the Federal Reserve. There was no significant discussion over whether the Federal Reserve was going to provide backup facilities to AIG because of two distinguishing characteristics: One, they were huge. They were global. They were bigger than Lehman Brothers. But the more important distinction is that the Fed is in the business of providing loans when it is "secured to its satisfaction." And AIG had the benefit of having solvent, highly regulated, very valuable insurance subsidiaries to which the Federal Reserve felt comfortable extending its loan facilities.

[See more companies likely to fail this year.]

After that we get to Sept. 17 2008, which was essentially the creation of the TARP concept. It was at that point that there was a meeting of the minds between Paulson, Bernanke, and Geithner that enough is enough, we're going to break the back of this crisis, and we're tired of not having the tools to deal with this crisis. And the judgment was made that we were going to ask for broad authority from Congress.

At that point, it was essentially 24-hour duty at the Treasury Department. Some people slept there.

Kevin Fromer, former assistant treasury secretary for legislative a ffairs: For context, this was a program about the size of the entire federal operating budget on an annual basis. Congress usually works through that process for 10 or 15 months, just to keep the lights on. We were asking Congress for $700 billion in basically a week or two. In the context of a national election. An election year is typically not the year to do big things.

We had one week left in the legislative calendar. It was not possible to do it in a week. I wasn't sure it was possible to do it at all. We needed to get somewhere fast, so we sent up the infamous three-page bill, which was draft legislative text the committees needed to start the discussions.

[See why the markets hate the idea of bank nationalization.]

Swagel: It was very difficult to say, if this shock happens, you will get this economic effect. In September, the nation as a whole didn't understand that what was happening in the credit markets would matter to them. There was this sort of Wall Street-Main Street divide. It was hard to explain to people why this mattered.

The week of Lehman and AIG, there was a panicked flight from mutual funds, and that led to a lockup in commercial paper. In our view, that was really the key, the CP market breaking down. That had a direct link to investment. Businesses use that to fund their daily operations. That would lead to a direct plunge in business spending, and that's exactly what we've seen over the last two quarters. A very sharp decline in business investment.

The one-month Libor [London interbank offered rate] spread is a measure of stress in bank lending. It's really, do you trust a bank to hold your money for a month. After that week, the stresses in the bank funding markets were huge. To us, that week, it looked very much like a run on the entire financial system. ( NB DON )

Nason: We were afraid of a complete and utter collapse of the global financial system.( NB DON )

Swagel: Imagine if the Fortune 500, blue-chip companies, can't buy paper clips or meet their payroll. All the things these firms rely on money-market funds and commercial paper for. And it goes downhill from there. It starts with the big firms and then every firm in the nation.

Fromer: This was an extremely difficult communications challenge. It made it enormously difficult to sell the package to Congress and for them to sell it back home. They were angry when they came back from home after the election. They had seen the amount of money they were being asked to put into institutions, getting anecdotal information from small businesses and lending institutions, and the picture was, we've invested significantly in these institutions, and we're not seeing credit flow to consumers and small businesses.

The markets were volatile for quite some time, and people became desensitized to volatility in the markets. What people didn't understand, which was quite reasonable, was the credit markets, how credit is provided in this country. That's not a criticism; it's arcane to anybody without a certain educational background. It's an almost-impossible-to-explain set of circumstances.

Nason: People were getting used to seeing the stock market go up and down. We were trying to explain, "What's happening in the equity market is not really what we're worried about. We're worried about some other market that you've never seen and aren't familiar with," and people look at you like you're insane because you're asking for $700 billion and you can't provide anything besides a chart to show why it's important.

[Here's the chart, which shows how rapidly widening credit spreads reflect a seizure in the credit markets.]

People could appreciate the money-market mutual funds situation. There is $3.3 trillion of money invested in money-market mutual funds. A panic in these funds helped in terms of selling the importance of our message. And the commercial-paper market stress was important in communicating this as well. If that market collapses, you could have huge employers saying, I'm going to start laying people off. I'm going to start shutting plants down, I'm going to start defaulting on my bonds, and that's going to trigger bankruptcy( NB DON ). Those are the kinds of things you had to say, in the doomsday scenario, to convince people that this was critical to the system.

After [the first TARP vote] failed in the House [on September 29], then the equity markets finally responded. [The Dow Jones industrial average plunged 778 points.]

Fromer: It was clearly a response that forced a number of people to say, "OK, we get it now."

Swagel: Even after the legislation passed, stresses in bank funding still got worse. So we got what we needed; we were thinking about buying assets, but we needed to think more broadly.

Nason: There were two purposes at the time. This is a critically important point and something the current administration is suffering under. The dual purposes were financial system stability and provision of credit to the economy. People are not focused at all on the fact that the former is the primary reason we went up and asked for emergency authority. To derail a total breakdown of the financial markets and the global financial system. And we believe and hope that the confluence of programs put into place in a very short period of time actually did that.

The second part of it is, getting credit flowing into the economy. People seem to only focus on, "Why isn't this money being put into the economy?" That's important, of course, but you have to remember a significant portion of this money was there to be a buffer against future losses.

Swagel: To me, the stabilization of the financial markets is the salient accomplishment of the TARP and the actions of the Treasury in the fall. The normal playbook for dealing with a bank crisis is first, winnow out the banking sector so the zombie institutions don't clog up the credit channels and divert resources. As a society, I'm not sure we're going to do that. Next is stabilize, inject capital into the firms that are left so they're still viable. And No. 3 is do something about the balance sheets. Give certainty about the performance of the assets and the viability of the firms. I think we did No. 2, we stabilized the system. No. 3 is still the ongoing challenge.

Nason: The reason the TARP morphed from asset purchases to injecting capital is really quite practical. Asset purchases were taking longer than we had hoped, and it was more complicated with the vendors. Also, we needed to be in lockstep with our brethren around the world. The U.K., France, and Germany were prepared to guarantee the liabilities of the banking sector and were going to deploy capital into their banks.

Fromer: The folks in place right now clearly have the advantage of looking back at what we did and the conditions that existed when we did it. They're benefiting from experience. A number of them were part of the process going back to last summer.

Swagel: The job of the TARP has not been done, but the first step is done. In terms of the larger picture of what matters to families, we're still pretty far away from getting back to normal.

Nason: There are still valuation problems with a lot of the assets on bank balance sheets. Then we still have to deal with inevitable credit contraction.

Fromer: It's not conceivable to me that there's a TARP II. It's going to take time for these programs to stand up and operate and invoke full participation from all quarters. Given dynamics right now, I think it's unlikely there will be another TARP."

Friday, May 15, 2009

That, too, is a disappointment for those who are waiting for increased consumption spending to lift us out of recession

TO BE NOTED: From Econbrowser:

Where's my recovery, dude?

A couple of disappointments in this week's data.

New claims for unemployment insurance have peaked just before the end of each of the last half-dozen recessions.


Black line: 4-week average of seasonally adjusted weekly initial claims for unemployment insurance, from Department of Labor via Webstract. Shaded areas correspond to recessions as judged by the National Bureau of Economic Research.
new_claims5_may_09.gif

Unfortunately, the Labor Department reported today that seasonally adjusted new claims for unemployment insurance rose by 32,000 for the most recent available week. That bumps the 4-week average to 630,000, up 6,000 from its value the previous week, though the average is still below its peak of 659,000 reported April 9. That the downward trajectory will resume next week is far from clear.


Black line: seasonally adjusted weekly new claims for unemployment insurance from January 1 through May 14, 2009. Blue line: 4-week average.
new_claims6_may_09.gif

We also received the news yesterday that monthly sales for retail and food services fell 0.4% in April, the second consecutive monthly drop. That, too, is a disappointment for those who are waiting for increased consumption spending to lift us out of recession.


Source: FRED.
retail_sales_may_09.png


Technorati Tags: , , ,

Posted by James Hamilton "

these turnover numbers tell a clear story: layoffs aren’t the main problem. A lack of hiring is.

TO BE NOTED:


May 15, 2009, 11:38 am

Layoffs Aren’t the Main Problem

What makes the Great Recession different from all other recent recessions is not mainly the number of workers being laid off. It’s how few workers are being hired.

Look at this chart, from the Labor Department’s latest report on labor turnover (which Catherine Rampell also wrote about recently):

INSERT DESCRIPTIONSource: Bureau of Labor Statistics

It makes the current recession look qualitatively different from the 2001 recession, right?

The line in the chart is showing the rate at which employers hire new workers. (To be more precise, it is the total number of workers hired in a given month, divided by total nationwide employment, expressed in percentage terms.) Hiring has essentially fallen off a cliff over the last year and a half. It’s far lower than it was during the 2001 recession.

Now consider this chart, which shows the rate at which companies lay off workers:

INSERT DESCRIPTIONSource: Bureau of Labor Statistics

Layoffs have clearly soared in the last six months. And the layoff rate has been high for longer in this recession than it was in 2001. But it has not hit a new peak. It’s merely tied its old peak. The layoff rate was roughly the same in March 2009 as it was in March 2001. (Unfortunately, these numbers exist back to just 2000, but another survey suggests the peak layoff rate in the 1990-91 recession was at least as high as the current rate.)

You don’t see these numbers on hires and layoffs very often. The much better known statistic is the net number of jobs added or lost, which comes from the Labor Department’s monthly employment report. The most recent report showed that 539,000 jobs had been lost in April. This net number is the difference between the hiring and layoff numbers, along with a couple of other categories, like the number of workers who quit their jobs.

Imagine, for example, a company that has 100 workers at the start of the month. If it lays off 6 of those workers and hires 5 new workers, the monthly employment report will show a net loss of 1 job. But the turnover survey will show the details behind that net loss: 6 layoffs and 5 hires.

When people talk about the enormous job losses of the last year, they tend to assume that job cuts are the main reason. But these turnover numbers tell a clear story: layoffs aren’t the main problem. A lack of hiring is.

Why? How should the government respond? How should the country’s long-term economic policies be changed to reverse this long-term decline in hiring? All are good, hard questions.

It’s hard to see how we’ll find the right solutions if we are misdiagnosing the problem."

Capacity utilization shrank in April to 69.1%, a historical low since records began in 1967

TO BE NOTED: From EconomPic Data:

"Capacity Utilization at Lowest Level Since 1967

WSJ reports:


U.S. industrial production tumbled a 15th time in 16 months during April, cut down by massive business inventory liquidation.

Industrial production decreased by 0.5% in April compared to the prior month, the Federal Reserve said Friday. Output fell 1.7% in March, revised from a previously estimated 1.5% decline.

Capacity utilization shrank in April to 69.1%, a historical low since records began in 1967. March capacity use was a revised 69.4%; originally, "cap-U" was estimated at 69.3% in March. The 1972-2008 average was 80.9%.

Industrial Production

Capacity Utilization

Thursday, May 14, 2009

This shows that retail sales fell off a cliff in late 2008, and are still declining - but at a slower pace.

TO BE NOTED: From Calculated Risk:

"Retail Sales Decline in April

by CalculatedRisk on 5/13/2009 02:07:00 AM

On a monthly basis, retail sales decreased 0.4% from March to April (seasonally adjusted), and sales are off 11.4% from April 2008 (retail and food services decreased 10.1%).

The following graph shows the year-over-year change in nominal and real retail sales since 1993.

Year-over-year change in Retail Sales Click on graph for larger image in new window.

To calculate the real change, the monthly PCE price index from the BEA was used (April PCE prices were estimated as the average increase over the previous 3 months).

Although the Census Bureau reported that nominal retail sales decreased 11.4% year-over-year (retail and food services decreased 10.1%), real retail sales declined by 11.9% (on a YoY basis).

Real Retail Sales The second graph shows real retail sales (adjusted with PCE) since 1992. This is monthly retail sales, seasonally adjusted.

NOTE: The graph doesn't start at zero to better show the change.

This shows that retail sales fell off a cliff in late 2008, and are still declining - but at a slower pace.

Here is the Census Bureau report:

The U.S. Census Bureau announced today that advance estimates of U.S. retail and food services sales for April, adjusted for seasonal variation and holiday and trading-day differences, but not for price changes, were $337.7 billion, a decrease of 0.4 percent (±0.5%)* from the previous month and 10.1 percent (±0.7%) below April 2008. Total sales for the February through April 2009 period were down 9.2 percent (±0.5%) from the same period a year ago. The February to March 2009 percent change was revised from -1.2 percent (±0.5%) to -1.3 percent (±0.3%).

Retail trade sales were down 0.4 percent (±0.7%)* from March 2009 and 11.4 percent (±0.7%) below last year. Gasoline stations sales were down 36.4 percent (±1.5%) from April 2008 and motor vehicle and parts dealers sales were down 20.7 percent (±2.3%) from last year.
No green shoots here.

There has been a race between declining sales and declining inventory.

TO BE NOTED: From Calculated Risk:

"Update on Inventory Correction

by CalculatedRisk on 5/13/2009 11:05:00 AM

The Q1 GDP report showed a strong inventory correction is under way, with the BEA reporting inventories declined -136.8 billion (SAAR) in Q1. The Manufacturing and Trade Inventories and Sales report from the Census Bureau today showed more evidence of declining inventories.

Inventory Correction Click on graph for larger image in new window.

The Census Bureau reported:

Manufacturers' and trade inventories, adjusted for seasonal variations but not for price changes, were estimated at an end-of-month level of $1,404.1 billion, down 1.0 percent (±0.1%) from February 2009 and down 4.8 percent (±0.3%) from March 2008.
The above graph shows the 3 month change (annualized) in manufacturers’ and trade inventories. The inventory correction was slow to start in this recession, but inventories are now declining sharply.

Inventory Correction However, even with the sharp decline in inventories, the inventory to sales ratio was flat in March at 1.44.

There has been a race between declining sales and declining inventory. And even if sales start to stabilize, inventory levels are still too high, and further inventory reductions are coming.

Wednesday, May 13, 2009

"We don't normally use the word plummet but that is the operative word right now,"

TO BE NOTED:

Need a Real Sponsor here

State tax collections continued to fall in the first quarter as muted consumption, falling incomes and weak profits plunged states into a deeper financial hole, the Nelson A. Rockefeller Institute of Government at the State University of New York said in a report to be released Wednesday.

The 47 states that have reported first-quarter revenues saw total tax collections fall 12.6% -- about $20 billion -- compared with the first three months of 2008, the institute said.

The steepest drops were in income taxes: Corporate income taxes declined 16.2% in the latest quarter, reflecting weaker profits. Personal income taxes fell 15.8%. Sales taxes were down 7.6%. Forty-five of the 47 states saw revenues decline.

Robert Ward, deputy director of the institute, said he expects tax collections to fall further in the second quarter, with weak consumer spending, rising unemployment and stock-market turmoil almost certain to reduce income taxes from earners large and small. "We don't normally use the word plummet but that is the operative word right now," said Mr. Ward.

Tax returns filed in April likely contain unwelcome news from high-income earners. "The expectation is that April income tax collections will be very weak," he said.

The worst recession in a generation is forcing municipalities of all sizes to furlough employees and cut programs in areas such as public safety and education. To cope, state and municipalities are scrambling for federal stimulus money, and some are raising tax rates.

Write to Conor Dougherty at conor.dougherty@wsj.com"

Tuesday, May 12, 2009

Part Time Worker Spike

TO BE NOTED: From EconomPic Data:

"Unwanted Part Time Worker Spike

In response to my post Net Claims is What Matters, Locust responds:

For what it's worth...

I work as a W-2 employee on a project by project basis. One of the things I've noticed - and this seems to be a relatively new phenom - is that I am being contracted for fewer days. So what used to be a typical 5 week project (25 days) is now shaved down to 4.5 weeks (22 days).

Yeah, it's just 3 days. But multiply that times 100 people and it's a year of employment in man days that's gone poof.
That theme also plays out in the data.


Source: BLS

Monday, May 11, 2009

percentage of net worth, household debt -- which includes mortgages -- stands at 27 percent, the highest on record

TO BE NOTED: From Bloomberg:

"U.S. Recovery May Start, Then Sputter as Zarnowitz Rule Is Bent

By Rich Miller and Matthew Benjamin

May 11 (Bloomberg) -- The Zarnowitz rule may live, but not for long.

The current contraction may so far be following the economic law named for Victor Zarnowitz, the late expert on business cycles: Deep recessions are almost always followed by rapid rebounds. Consumer confidence rose by the most in more than two years in April as surging stock prices and falling mortgage rates boosted optimism. A gauge of U.S. manufacturing activity had its biggest bounce since 2005 as companies eased up on efforts to slash inventories. Even the crippled housing market has shown signs of stabilizing.

The risk is that any snapback may end up stunted by structural impediments -- from heavily indebted consumers to a hobbled banking system -- that continue to weigh on the economy and may prevent a sustained run of rapid expansion.

“We could see one or two quarters of 6, 5, 4 percent growth,” says Joel Naroff, president of Naroff Economic Advisors Inc. in Holland, Pennsylvania, who was the top forecaster of the U.S. economy in Bloomberg News surveys last year. “But that doesn’t mean that the economy will be in good shape. We’ll just be going from truly gruesome to bad.”

Bridgewater Associates agrees. The Westport, Connecticut- based financial firm, which says it manages $72 billion in assets, sees a good chance of a big spurt in the economy late in the year, with growth then settling back to a trend line of a shade over 2 percent. That would be well below the postwar rate of 3.3 percent.

Weak Performance

The economy shrank at an annual pace of 6.1 percent in the first quarter after contracting by 6.3 percent in the previous three months, the weakest six-month performance since 1957-58. Inventory cutbacks alone accounted for 2.79 percentage points of last quarter’s decline, as businesses slashed stockpiles at the fastest pace since government records began in 1947.

That has some economists expecting a fillip when companies ramp output back up after reducing unsold supplies to desired levels. If the increase is concentrated in a short period of time, the impact on growth in any given quarter might be significant.

“An important influence on the near-term economic outlook is the extent to which businesses have been able to shed the unwanted inventories,” Federal Reserve Chairman Ben S. Bernanke told lawmakers on May 5. “As stocks move in better alignment with sales, a reduction in the pace of inventory liquidation should provide some support to production.”

Making Toyotas

That may already be happening at some companies. Toyota Motor Corp. is boosting the speed of a Camry assembly line in Georgetown, Kentucky, and is scheduling overtime at a factory building RAV4 sport utility vehicles in Woodstock, Ontario, as stockpiles ran low following previous output cuts.

Housing is another area that may prove to be a surprise source of strength. Homebuilding began to buckle in 2006, chopping 1 percentage point from annual economic growth ever since. As the market stabilizes, that drag will dissipate, giving the economy a short-term boost.

“Housing looks like it has bottomed,” says Allen Sinai, chief economist at Decision Economics in New York.

Confidence among homebuilders rose in April to its highest level since October as record-low mortgage rates below 5 percent started to stir demand. Prices for home resales in March posted their biggest monthly gain since June 2005, with some regions seeing multiple bids on properties.

‘Seeing a Floor’

In southern California, one of the hardest hit areas, prices have begun to stabilize, according to KB Home Chief Executive Officer Jeffrey Mezger. “We’re seeing a floor,” he said in a May 4 call with analysts. That’s giving the Los Angeles-based company an opening to sell newly built homes.

The economy will also get a lift from President Barack Obama’s $787 billion stimulus package of spending increases and tax cuts, which was signed into law in February and is only now starting to kick in. While Federal agencies have allocated $88.1 billion of investment, so far just $28.6 billion has been spent.

Louis Crandall, chief economist at Wrightson ICAP LLC, a Jersey City, New Jersey-based research firm, says consumers will also benefit this month from some $13 billion in extra Social Security payments.

That leads Michael Mussa, a former chief economist of the International Monetary Fund, to argue that the U.S. will enjoy a so-called V-shaped recovery. Mussa, who’s now at the Peterson Institute for International Economics in Washington, invokes Zarnowitz in saying “there is no good reason to presume” that this recovery won’t be a strong one.

Soviet Gulag

Zarnowitz, a native of Poland, fled the Nazis in 1939 only to end up in the Soviet gulag. After making it to the U.S. in 1952, he became a professor of economics at the University of Chicago and a leading expert on business cycles and economic indicators. He joined the National Bureau of Economic Research in 1952, where he was one of the seven economists who date recessions and expansions. He died in February at age 89.

Many economists, including Naroff, disagree with Mussa. David Rosenberg, former chief North American economist at Bank of America and now chief economist at Gluskin Sheff & Associates Inc. in Toronto, says the current contraction isn’t a typical, inventory-driven recession: “This is a deleveraging cycle.”

Consumers are still saddled with hundreds of billions of dollars in debt built up during the boom years when home prices skyrocketed. As a percentage of net worth, household debt -- which includes mortgages -- stands at 27 percent, the highest on record, according to John Lonski, chief economist at Moody’s Capital Markets Group.

Wealth Walloped

Americans have also seen their wealth walloped. U.S. house prices rose 63 percent from 2002 to June 2006 and then fell 27 percent since that peak, according to national Case-Shiller data. The Standard & Poor’s 500 index hit a 12-year low in March and now stands 42 percent below its October 2007 peak.

As a result, households are being forced to save more and spend less. Lyle Gramley, a former Fed governor who is a senior economic adviser for New York-based Soleil Securities Corp., sees the savings rate rising to 7 to 8 percent over the next few years from an average of 1.7 percent during the past decade.

An added reason for restraint: the continued rise in unemployment, which climbed to a 25-year high of 8.9 percent in April from 8.5 percent in March.

Banks have also turned more cautious after piling up close to $1 trillion in lending and investment losses during the last two and a half years. A Fed survey released May 4 found that banks toughened terms on home and credit-card loans in the past three months.

According to stress tests carried out by regulators, the nation’s biggest banks need $74.6 billion in additional capital to be able to weather a further worsening of the economy and keep on lending.

“The biggest financial crisis in 70 years is likely to leave a legacy with consumers, business people and investors,” says Richard Berner, co-head of global economics for Morgan Stanley in New York. That “will have an impact on the kind of economic activity and the kind of rebound we’re likely to get.”

To contact the reporters on this story: Rich Miller in Washington rmiller28@bloomberg.netMatthew Benjamin in Washington at mbenjamin2@bloomberg.net"

Saturday, May 9, 2009

employers are laying off workers who are really valuable. These are the hardest workers to get rid of.

TO BE NOTED: From Marketplace:

"
Why the pace of layoffs has slowed
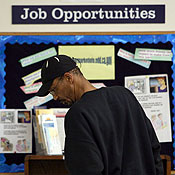
A job seeker looks at job listings

Last month's unemployment numbers are out, and they're not as bad as some experts expected. But half a million layoffs is still a whole lot of people. John Dimsdale reports.

A job seeker looks at job listings posted at the East Bay Works One-Stop Career Center in Oakland, Calif. (Justin Sullivan/Getty Images)

More on Jobs, America's Financial Crisis

TEXT OF STORY

KAI RYSSDAL: The actual number was 539,000. That's how many people lost their jobs last month. The way things have been going, not as bad as a lot of experts had been guessing. And this morning's report does give some credibility to the 'hey, things are turning around' school of economic thought.

But the unemployment rate -- the number of people out there actually looking for work -- shot up to 8.9 percent. That's the highest that's number's been since Ronald Reagan's first term. The current occupant of the Oval Office pointed out that at least the rate of loss is slowing. But Marketplace's John Dimsdale reports that a half a million layoffs in one month is still a whole lot of people.


John Dimsdale: For President Barack Obama fewer layoffs mean the economic gears are slowly beginning to turn. But Econoplay forecaster Gary Rosenberger, who gathers his own statistics by talking to employers on the front lines of the economy, sees evidence of a different sort.

Gary Rosenberger: They're telling us this is not a sign of a turnaround. This is a sign that layoffs have gotten to the point where employers are laying off workers who are really valuable. These are the hardest workers to get rid of.

Which is why the pace of layoffs has slowed. John Challenger at the outplacement firm Challenger Gray and Christmas says companies are doing all they can to avoid letting workers go.

John Challenger: Four-day work weeks, salary freezes. In fact we're seeing some companies cut their wages 10 to 15 percent.

Because they want to be ready when the rebound occurs.

Challenger: If the people aren't there they may not have the operations to provide the quality product or service they need. So companies have to be very careful here not to overshoot the mark.

To take better advantage of furloughed workers, Obama called for allowing them to collect unemployment benefits while going to school or taking part in retraining programs.

Barack Obama: The idea here is to fundamentally change our approach to unemployment in this country, so that it's no longer just a time to look for a new job but is also a time to prepare yourself for a better job.

The president announced a new Web site with education resources for the unemployed, at opportunity.gov.

In Washington, I'm John Dimsdale for Marketplace."

Thursday, April 30, 2009

Most of the companies, not all, have taken a much more aggressive approach as soon as they saw business start to decline

TO BE NOTED: From Bloomberg:

"Job Cuts Avert Catastrophic Quarter as Profits Excel (Update1)

By Edmond Lococo and Scott Hamilton

April 30 (Bloomberg) -- Corporate earnings worldwide haven’t been the disaster analysts predicted as companies from Ford Motor Co. to Siemens AG beat earnings estimates through job cuts, factory consolidations and a dose of lowered expectations.

“It’s one of those things where you walk away from the car crash and think, ‘Well, that could’ve been a lot worse,’” said Andy Lynch, who helps manage about $5 billion at Schroder Investment Management Ltd. in London. “The first quarter is marginally less catastrophic than feared.”

Some 188 members of the Standard & Poor’s 500 Stock Index have topped analysts’ estimates, or 69 percent of the 271 companies reporting so far. That’s more than the 62 percent for all of the previous quarter, Bloomberg data shows. In Europe’s Dow Jones Stoxx 600 Index, half of the 110 members reporting so far beat estimates, up from 38 percent in the previous quarter.

One reason is the low hurdle the companies set earlier this year by reducing forecasts, rather than any recovery from the deepest U.S. recession in a half-century, investors and analysts said. At the start of April, equity analysts estimated earnings among S&P 500 companies fell 37 percent in the first quarter. Six months earlier they had been calling for a 22 percent gain.

“At the end of last year companies took a much more conservative stance,” said Michael Jaffe, the senior director of industrial research at Standard & Poor’s in New York. “They were being ultraconservative and looking at the worst-case scenario. That would give them an opportunity to beat estimates. They didn’t want to try and promise too much, which was probably a smart move.”

Shedding Jobs

U.S. employers have eliminated about 5.1 million jobs since the slump began in December 2007 in an effort to cut costs. U.S. gross domestic product dropped at a 6.1 percent annual pace in the first quarter and a 6.3 percent rate in late 2008, the Commerce Department said yesterday. European unemployment increased in February to 8.5 percent, the highest in almost three years.

Texas Instruments Inc., the second-largest computer-chip maker, on April 20 reported net income of 1 cent a share instead of the 4-cent loss that was the average estimate in a Bloomberg survey of analysts. The Dallas-based company in January announced plans to eliminate 12 percent of its jobs and in March forecast a loss of as much as 8 cents a share.

“The industry has a much better ability to adapt to slowing demand than we as analysts were able to model,” said Doug Freedman, an analyst at Broadpoint AmTech in San Francisco. “They were able to reduce their expenses at the same time as they worked down their inventory levels.”

Technology Companies

Texas Instruments reduced costs by $115 million in the quarter, more than double the target of $40 million, Ron Slaymaker, its manager of investor relations, said in an interview. The company has gotten costs “realigned with the realities of the economic environment,” he said.

Technology companies learned lessons from the industry’s bust earlier in the decade, when many were too slow to cut expenses, said Heather Bellini, a UBS Securities LLC analyst in New York. “Most of the companies, not all, have taken a much more aggressive approach as soon as they saw business start to decline,” Bellini said.

Munich-based Siemens, Europe’s largest engineering company, yesterday said operating profit at its main units rose 43 percent to 1.84 billion euros ($2.45 billion), ahead of analysts’ average estimate of 1.66 billion. Some 19,000 workers will be on shorter shifts by mid-year, Chief Executive Officer Peter Loescher said. He’s cutting costs in purchasing and administration to offset a slide in demand for automated factory controls and lighting.

Europe’s Stoxx 600, up 1.5 percent today, is poised for the biggest monthly gain on record as German chemical supplier BASF SE joined the ranks of companies whose profit excelled.

Narrower Losses

Stockholm-based Electrolux AB and Dearborn, Michigan-based Ford were among the companies that beat estimates even while posting losses.

Electrolux last week climbed to its highest stock price in seven months after reporting a net loss that was narrower than analysts predicted. The world’s second-biggest appliance maker cut 2,000 jobs and moved factories.

Ford shares rose 11 percent on April 24 after the second- largest U.S. automaker reported a loss of 75 cents a share, excluding items it considers one-time costs, narrower than the $1.24 loss analysts predicted.

Ford, the only U.S. automaker not on federal aid, reduced its worldwide employment by almost 4 percent in the quarter to 205,000 from 213,000 at the end of the year and cited $1.9 billion in savings, including more-efficient manufacturing. Midcontract concessions won in March will allow consolidation of vehicle assembly at two Michigan factories.

Health-Care Earnings

Out of 24 industry groups in the Standard & Poor’s 500 index, 21 groups have so far reported a lower average profit for the quarter and only three had gains: health care, real estate and utilities.

Drugmakers turned in estimate-beating earnings built upon job cuts, plant closings and price increases adopted in recent years, said Les Funtleyder, a Miller Tabak & Co. health-care analyst in New York.

New Brunswick, New Jersey-based Johnson & Johnson, the world’s largest health-care company, began paring as many as 4,400 jobs in 2007. New York-based Pfizer Inc. has cut 14,000 positions since then. Bristol-Myers Squibb Co., also of New York, has said it plans to remove $2.5 billion in costs over the next three years. All three beat profit estimates even as they said top-selling drugs lost sales to generic competitors in the first quarter.

Potential Red Flag

Heerlen, Netherlands-based Royal DSM NV, the world’s largest maker of vitamins, earlier this week said operating profit plunged 76 percent to 57 million euros, exceeding the average estimate of 51 million euros. The company said it plans to cut 250 jobs beyond the 1,000 reductions already announced.

Far from being a buy signal, sometimes earnings that beat estimates should be a “major red flag for investors” because they were achieved by cutting costs that may restrict growth, said David MacGregor, a Longbow Research analyst in Independence, Ohio.

“The assets they are closing or rationalizing today, a year ago they would have said they needed for the recovery phase,” MacGregor said. “Recovery is not imminent, and is far enough into the future that they are re-sizing the business to a much lower level.”( NB DON )

To contact the reporter on this story: Edmond Lococo in Boston at elococo@bloomberg.net; Scott Hamilton in London at shamilton8@bloomberg.net."

Wednesday, April 29, 2009

Companies that are already lean and efficient are more likely to add to payrolls and boost investment once the clouds lift

TO BE NOTED: From the WSJ:

If you think the 6.1% drop in first-quarter U.S. gross domestic product was bad, then don’t go to the end of Wednesday’s report from the Commerce Department.

An appendix table noted the nonfarm business value added, which economists use to estimate productivity, plunged an even faster 8.2% last quarter, at an annual rate.

Still, nonfarm productivity, which is defined as output per hour of labor, will likely come in flat or down only slightly for a second-consecutive quarter — a heroic effort, given the extent of the economic contraction over the past six months.

Productivity shrank just 0.4% in the fourth quarter, at an annual rate, despite a 6.3% contraction in GDP and 8.8% drop in nonfarm value added.

J.P. Morgan Chase economist Michael Feroli said the mix of output and hours-worked figures suggests productivity was roughly flat last quarter. For 2008, productivity grew an astounding 2.8% from 2007 even as the economy suffered through its worst recession in decades.

To put that in perspective, the last time the U.S. had recessions approaching the current one in severity, in the mid 1970s and early 1980s, productivity posted quarterly drops of as much as 5%.

If productivity’s recent resilience reflects a stronger underlying trend than economists have assumed, it bodes well for an eventual recovery. Companies that are already lean and efficient are more likely to add to payrolls and boost investment once the clouds lift.

But there’s another, darker interpretation to the recent productivity figures: Companies may be cutting staff and investment so much to reduce costs that they cripple their underlying efficiency over the long run. Gross private investment plunged more than 50% last quarter at an annual rate, according to the GDP report. Even equipment and software fell by more than 33%, suggesting the investment drop is more than just homes and buildings.

In other words, with productivity, there is such a thing as too much of a good thing.

Barry Bosworth, a productivity expert at the Brookings Institution, said the U.S. may be near that tipping point.

“So far, [companies'] actions on employment have been justified by subsequent declines in output,” he said.

However, “I would agree that if you think you’re going to have a recovery — which you hope firms are still planning on — it’s getting to the point where they’re endangering their ability to expand in the future,” Bosworth said."

business sector, where firms halted new investments, and shed workers and inventories at a dizzying pace

TO BE NOTED: From EconomPic Data:

"Q1 GDP Down 6.1%

Marketwatch reports:


The U.S. economy contracted violently again in the first quarter of the year as business investment declined at a record rate, the Commerce Department reported Wednesday. Real gross domestic product fell at a 6.1% annualized rate in the first quarter, nearly matching the 6.3% decline in the fourth quarter of 2008. The two-quarter contraction is the worst in more than 60 years. The big story for the first quarter was in the business sector, where firms halted new investments, and shed workers and inventories at a dizzying pace to bring down production and stockpiles to match the lower demand from U.S. and foreign markets.

Source: BLS

Companies trimmed stockpiles at a $103.7 billion annual rate last quarter, the biggest drop since records began in 1947

TO BE NOTED: From Bloomberg:

"Economy in U.S. Shrank at 6.1% Rate in First Quarter (Update2)

By Bob Willis

April 29 (Bloomberg) -- The U.S. economy plunged again in the first quarter, capping its worst performance in five decades, reflecting a record slump in inventories and further declines in housing.

Gross domestic product dropped at a 6.1 percent annual pace, more than forecast, after contracting at a 6.3 percent rate in the last three months of 2008, the Commerce Department said today in Washington. The report, which marked the weakest six months since 1957-58, comes as Federal Reserve policy makers meet for a second day.

Smaller stockpiles may set the stage for a return to growth in the second half of the year amid signs Fed efforts to reduce borrowing costs and unclog lending are starting to pay off. The recession persisted even as lower gasoline prices and larger tax refunds helped bring an end to the worst slump in consumer spending in almost three decades.

“This is one of those good-bad numbers,” Joel Naroff, president of Naroff Economic Advisors Inc. in Holland, Pennsylvania, said in a Bloomberg Television interview. “Businesses are running about as lean as they possibly can be. It sets up the reality that any sort of increase in demand will cause firms to have to increase production.”

As a result, Naroff predicted growth won’t “be nearly as bad in the current quarter, and will probably be reasonably good.”

Stock-Index Futures

Stock-index futures were higher, with futures on the Standard & Poor’s 500 Index up 1.1 percent at 860.9 as of 8:50 a.m. in New York. Treasuries were little changed, with benchmark 10-year notes yielding 3 percent.

The median forecast of 71 economists surveyed by Bloomberg News projected GDP, the sum of all goods and services produced, would shrink at a 4.7 percent pace. Estimates ranged from declines of 2.8 percent to 8 percent.

The world’s largest economy shrank 2.6 percent in the first quarter compared with the same period a year earlier. Today’s advance report on GDP is the first of three estimates on first- quarter growth.

Consumer spending, which accounts for about 70 percent of the economy, climbed at a 2.2 percent annual pace last quarter, the most in two years. Purchases dropped at an average 4.1 percent rate in the last half of 2008, the biggest slide since 1980.

Stockpiles Plunge

Companies trimmed stockpiles at a $103.7 billion annual rate last quarter, the biggest drop since records began in 1947. Excluding the reduction, the economy would have contracted at a 3.4 percent pace.

“This is the combination you want for a turn in the economy -- better sales and an inventory correction,” John Silvia, chief economist at Wachovia Corp. in Charlotte, North Carolina, said before the report.

Companies cut total spending, including equipment, software and construction projects, at a record 38 percent annual pace.( NB DON )

Residential construction also decreased at a 38 percent pace last quarter, the most since 1980.

One reason for the larger-than-projected decline in GDP was that government slashed spending at a 3.9 percent pace, the most since 1995. The drop reflected cutbacks in defense spending and the biggest decrease in state and local government outlays since 1981.

Trade Gap

A smaller trade gap added 2 percentage points to growth last quarter. The deficit shrank as imports collapsed at a 34 percent annual pace, the most since 1975, which reflected the reduction in stockpiles.

Should the economy shrink again in the second quarter as projected by economists surveyed this month by Bloomberg, the recession that began in December 2007 would be the longest since the Great Depression.

Recent announcements by companies including General Motors Corp. indicate that will be the case. GM last week said it will idle 13 U.S. assembly plants for multiple weeks to trim production by 190,000 vehicles from May through July. Sales in its home market fell 49 percent this year through March.

General Motors and Chrysler LLC are threatened with bankruptcy as sales have plummeted since credit markets seized last year.

Still, data in recent weeks, including signs of stability in home sales, residential construction and consumer confidence, signal the world’s largest economy may shrink at a slower pace.

Fed Purchases

Part of the improvement may be due to government efforts to stem the recession. In its last meeting on March 18, the Fed pledged to double mortgage-debt purchases to $1.45 trillion and buy as much as $300 billion in long-term Treasuries. That’s helped bring down rates on mortgages and auto loans.

The central bank’s statement today, due at around 2:15 p.m., may acknowledge that the pace of economic decline has moderated in the past six weeks and may reiterate it will keep the benchmark rate low for an extended period and continue to boost its balance sheet to revive lending.

The Fed’s preferred measure of inflation, which tracks consumer spending and excludes food and fuel costs, rose at a 1.5 percent annual pace last quarter, toward the lower end of central bankers’ longer-term forecasts.

Ford Motor Co., working to avoid a federal bailout, is among companies seeing some improvement. The automaker last week posted a first-quarter loss that beat analysts’ estimates.

“We’re not quite sure where the bottom is,” Ford’s Chief Executive Officer Alan Mulally said in an April 24 Bloomberg Television interview. “But we believe with the stabilization of the banks, freeing up the credit, and the stimulus packages we have, both monetary and fiscal, that we’re going to see an uptick in the third and fourth quarter.”

To contact the reporter on this story: Bob Willis in Washington at bwillis@bloomberg.net"