Showing posts with label Unemployment Graphs. Show all posts

Monday, January 12, 2009

"I suspect that most people think both the Recession and Unemployment are worse now"

The Big Picture with two good posts about the history of the Unemployment Rate:

"Here’s the worst case scenario of the U6 Unemployment Rate, as noted in this Reuters article, Great Depression jobs parallel may not be far flung. I disagree with the article, and believe we are nowhere near depression levels of unemployment.

>
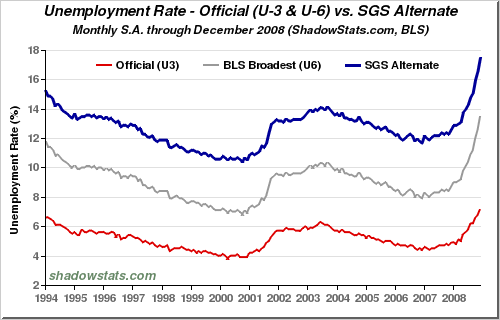
The series by John Williams’ Shadow Stats folds back all of the workers who have left the Labor Pool. We do not know how many are actual workers and how many have simply left the labor pool, so that 17.5% number probably skews high.( TRUE )

While I believe the 7.2% unemployment rate is laughably inaccurate, I do not think we are at 17.5% either . . .( I AGREE. BUT, AGAIN, GOVERNMENT NUMBERS ARE NOT NECESSARILY THE BEST NUMBERS. THEY ARE JUST THE NUMBERS THAT THE GOVERNMENT FINDS MOST USEFUL, FOR WHATEVER REASONS, IF ANY. )

>

Hat tip Paul

>

Source:
Great Depression jobs parallel may not be far flung
Pedro Nicolaci da Costa Reuters
Jan 8, 2009 9:37pm EST
http://www.reuters."

Now, the second post:

"Is the economy better or worse than it was in the early 70s? How about early 80s? What about Unemployment?( ALL BETTER NOW )

I suspect that most people think both the Recession and Unemployment are worse now than it was during either of those prior periods. ( I DISAGREE )

If that is the case, than what are we to make of the following chart below? It shows Unemployment peaking (after) the ‘74 recession at ~9%, and unemployment peaking (after) the ‘82 recession at 11%. Here we are 12 months into this recession, with Unemployment just over 7%.

I can think of several explanations for this anomaly: 1) The data is off( TRUE. BUT WE DON'T KNOW WHERE. ); 2) this recession is not as bad as those were( MY VIEW ); 3) structural changes in the economy mean less layoffs( MY VIEW ); 4) demographics are impacting people leaving the labor force, helping to keep UR lower( TRUE. A CASEY MULLIGAN POINT. ); 5) we have a lot further to run in terms of job losses( I HOPE NOT. ). Perhaps some combination of all 5 of these factors are involved. ( CORRECT )

>
click for ginormous chart
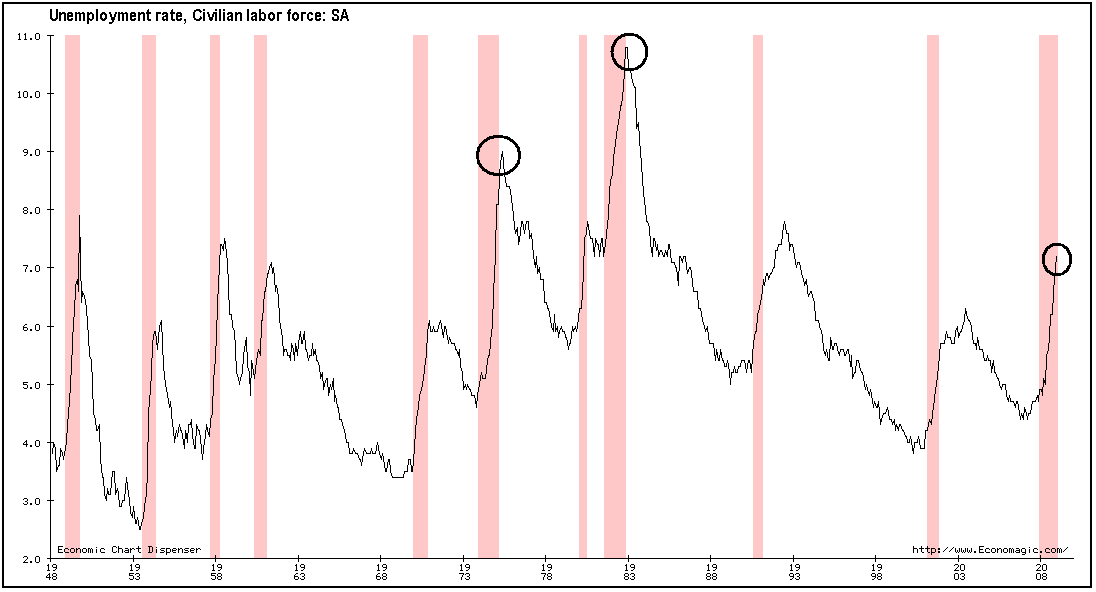
via economagic"

As you know, I believe that the economics of a given era are impacted by the context of the era. We are much better off today than in the past.

Saturday, January 10, 2009

If unemployment were being measured the same way as it was during the Depression, the U.S. would be well on its way to similar numbers.

I like Paul Kedrosky on this story:

"

There's Unemployment, and Then There's Unemployme
nt

I have been sent this Reuters story from yesterday umpteen times, so I may as well post it, as well as the underlying graph. The gist: If unemployment were being measured the same way as it was during the Depression, the U.S. would be well on its way to similar numbers( IT'S HARD TO DETERMINE HOW ACCURATE THESE NUMBERS HAVE BEEN OVER TIME. ).

Check the SGS line in the following graph from John Williams' ShadowStats:

Chart of U.S. Unemployment

Eye-opening, is it not?

A few quick comments:

  • Unemployment by SGS's measure is at almost 18%, but it's also not been under 10% in recent history.
  • The whole idea of employment/unemployment has changed a great deal over time, with, for example, there being more part-time and flex work etc., messing with figures.( TRUE )
  • The existence of a social safety net has, for better or worse( IT'S BETTER ), made it possible for people to withdraw permanently from the workforce without having to live on the streets.
  • There is no denying that there are far more able-bodied people out of work than the skewed-low U.S. BLS figures purport to show." ( I AGREE )
Government Stats are always of limited use since they are keyed to things like benefits and budgets. Again, Unemployment is not a good thing or a purgative.

Friday, December 5, 2008

"but if history is a guide, it's only going to get worse from here."

Although we've seen that there's no way to tell where the employment figures will trend from here, Zubin Jelveh isn't optimistic:

"It's probably the last thing anyone wants to hear so soon after news of the gawk-inducing 533,000 lost jobs suffered last month -- but if history is a guide, it's only going to get worse from here."

My opinion is that history can't tell us.

"That's because the majority of job losses in the 11 previous downturns came in the second half of the recession. We're 11 full months into the current one and most forecasters (what else do we have to go by?) think the recession will last through the end of next year."

Yes, these are projections.

"Let's assume that's somewhere near the truth. Out of all the jobs that were lost during the average recession since 1945, 26 percent of them came in the first half and 74 percent in the second half. There've been 1.9 million jobs lost thus far in the current downturn, so the historical average would mean we could lose another 5.7 million jobs, for a total of 7.6 million by the end. That would be the most jobs lost during a post-Great Depression recession. (If you factor in population, the short 1945 recession, which saw the evaporation of 3.3 million jobs, was worse.)"

When we looked at the averages earlier, there was just no way to tell where we're going.

"But there's at least one reason to have some optimism. Job losses in the three most recent recessions, including the 16-month 1981-82 downturn, were more evenly spread out with an average of 42 percent of all lost jobs gone in the first half and 58 percent in the second half.

What happened to cause the more balanced jobs picture?

One likely explanation is the Great Moderation, and now we just have to hope that the GM is not over with the collapse of the securitization market."

And so we're back where we started, unable to predict the future. What's new?

"Obviously the media wants the biggest record possible"

Rebecca Wilder on News N Economics has another view of the jobs lost:

"The November employment report was nothing but treacherous. The monthly nonfarm payroll fell 533,000, and the decline was broad-based. The goods-producing industries slashed another 163k jobs, while service industries cut more , 370k, which alone exceeds the market's expected decline in total nonfarm payroll , 300k.


There is absolutely no silver lining in this report, except that the last two men standing are education and health care and government, who added 52k and 7 jobs, respectively. But even those giants are subject to fall. The labor market is sliding off a cliff and setting all sorts of records along the way. However, the size of the record - 34 years or 28 years - depends how you measure the decline.

Obviously the media wants the biggest record possible:

U.S. job losses worst since 1974 as downturn deepens

…It's not true in percentage changes. The monthly percentage decline is the worst since 1980.

Somehow the media’s headlines sell better than would mine, but mine is a better representation of the proportion of the decline. A percentage change relates the magnitude of the payroll drop to the size of the payroll, which changes over time."

Her graphs make a similar point to the Bespoke chart I posted earlier.

"To be sure, the report was certainly troubling. A weak labor market – scratch that – a weaker-than-expected-and-set-to-worsen-futher labor market throws fuel on an already burning housing market and openly combusting consumption. But if the economy is going to get gloomier, why not wait to set the bigger record then?"

As shown in my last post, we are just going to have to wait and see where this employment situation is going.

"I’ll take the opportunity to step back and take in the current recession in a somewhat broader context"

Here's another take on the unemployment stats, from David Altiq on Macroblog:

"
The recession in pictorial context

If your head had not yet been turned by economic events, today’s startlingly weak employment report probably did the trick. Rather than repeat all the negative superlatives you are likely to hear, I’ll take the opportunity to step back and take in the current recession in a somewhat broader context. One way to look at this is to examine the trajectory of employment relative to December 2007 levels (when this recession began) and compare it with the average trajectory of relative employment in other recessions:

Non Farm Employment

In the graph above “time 0” represents the peak of a business cycle, or the month before a recession begins (December 2008 for the current recession). “Average” refers to the average experience in the seven previous recessions since 1960 (1960-61, 1969-70, 1973-75, 1980, 1981-82, 1990-91, and 2001). To facilitate comparison across recessions, I have normalized the level of employment at the peak of the business cycle to one. As noted, then, each point represents the level of employment relative to the peak: numbers below one indicate that the number of nonfarm jobs was below the number that existed as the economy entered recession.

Before the November job report, the overall employment picture had been fairly unexceptional compared to the average recessionary experience. That changed, as I guess will happen when a half-million job loss statistic arrives. As of today, a milder than average recession has turned into a somewhat deeper than average recession, at least in terms of employment."

Okay. We were in a fairly straightforward recession until now, when we've gone into a deeper recession than on average.

"Does this mean we are heading off the map in terms of past experience? It is hard to tell by just focusing on the average experience of the previous seven downturns. The previous two recessions—1990–91 and 2001—lasted only eight months. Assuming that we remained in recession through November—and I don’t think that conjecture will draw much debate—the current episode is already a year in duration. A more apt comparison might therefore be the “bad” recessions of recent memory, the 1973–75 and 1981–82 episodes, which both lasted sixteen months.

Here, for your viewing displeasure, are those comparisons:

Non farm Employment

Non Farm Employment

Not surprisingly, in the last two recessions, which were relatively short-lived, the employment situation had already stabilized twelve months after the onset of the downturn. So there may not be much comfort in noting that the employment losses are not yet out of line with experiences of those episodes (especially the 1990-91 version). The trajectories suggested by the relatively long-lived, more severe recessions of 1973-75 and 1981-82 are almost certainly more sensible comparisons at this point. And, as bad as it is right now, we are still a fair distance from the pace of relative employment losses in those episodes.

Okay. And?

"The story is similar if we adopt the vantage point of the unemployment rate:

Unemployment Rate

Unemployment Rate

Unemployment Rate

It is not yet clear whether the acceleration in job loss is a new trend or the lingering impact of a very bad few months, of which the worst is passing. It's always important to monitor new data and anecdotal reports to determine which way the wind is truly blowing. But today's report raised the stakes on that activity by a considerable amount."

It really does seem too soon to tell.