Showing posts with label Unemployment Rate. Show all posts

Friday, April 3, 2009

The government’s broader measure, known as the “U-6″ for its data classification, hit 15.6% in March — a big leap from 14.8% in February.

TO BE NOTED: From Real Time Economics:

"
By Sudeep Reddy

Americans are giving up on their job searches at a faster pace. The nation’s official unemployment rate jumped to 8.5% in March from 8.1%, putting U.S. joblessness at its highest since November 1983.

But the Labor Department’s most comprehensive gauge of unemployment surpassed even its early 1980s levels. The government’s broader measure, known as the “U-6″ for its data classification, hit 15.6% in March — a big leap from 14.8% in February.

The comprehensive measure of labor underutilization accounts for people who have stopped looking for work or who can’t find full-time jobs. The March figure is the highest since the Labor Department started this particular data series in 1994. It’s also above a discontinued and even broader measure that hit 15% in late 1982, when the official unemployment rate was 10.8%. (That data series goes back to the 1970s.)

The 8.5% unemployment rate is calculated based on people who are without jobs, who are available to work and who have actively sought work in the prior four weeks. The “actively looking for work” definition is fairly broad, including people who contacted an employer, employment agency, job center or friends; sent out resumes or filled out applications; or answered or placed ads, among other things.

The U-6 figure includes everyone in the official rate plus “marginally attached workers” — those who are neither working nor looking for work, but say they want a job and have looked for work recently; and people who are employed part-time for economic reasons, meaning they want full-time work but took a part-time schedule instead because that’s all they could find.

Many forecasters expect the official unemployment rate to top 10% by early next year. If the path of the broader unemployment rate continues, it’s likely to top 18%. For people in this group, comparisons to the Great Depression (when 25% of Americans were out of work) may not look so wild even if overall economic activity is holding up better."

Monday, February 9, 2009

long-term unemployment is also up a lot

From the NY Times:


February 9, 2009, 2:49 pm

Job Losses Are Scarier Now

I’ve been looking at the unemployment numbers that came out Friday, and a couple of things stand out.

Even though unemployment is rising rapidly — meaning there are a lot of people losing their jobs — long-term unemployment is also up a lot. Here are a couple of comparisons to illustrate that.

Highest overall unemployment rate in each downturn:
Current: 7.6%
2001-03: 6.3%
1990-92: 7.8%
1980-82: 10.8%
1973-75: 9.0%

Highest rate of unemployment for more than 15 weeks, as percentage of labor force:
Current: 3.0%
2001-03: 2.5%
1990-92: 2.9%
1980-82: 4.2%
1973-75: 3.1%

Over all, the jobless rate is below the early-1990s peak, but the rate of longer-term unemployment is higher.

Here is another interesting change in the nature of unemployment. In the early recessions of the post-World War II period, a much larger proportion of the unemployed were laid off from jobs that they could expect to get back when the economy recovered. Now, that proportion is down sharply.

But the percentage of unemployed who lost jobs, with no expectation of retaining the old job, is at the highest level since the government started collecting that data in 1967. It is reasonable to think those people are more worried, and less willing to spend, than are those who feel sure it is just a matter of time before they get back to their old jobs.

Here’s the current breakdown of the unemployed, by cause:

Lost job, other than layoff, 48.5%
Layoff, 12.6%
Left job voluntarily, 8.0%
Returning to labor force, 24.1%
New to labor force, 6.8%

(It is worth noting that the word layoff is used in its traditional sense — a temporary job loss until business improves. Many companies now use the word layoff to mean any firing, or at least any firing that is not for cause. Those “laid off” workers are counted in these numbers as “other than layoff.”)

The cyclical peak for the proportion of unemployed who lost their jobs for reasons other than layoffs were:

2001-03: 43.6%
1991-92: 44.9%
1980-82: 43.2%
1973-75: 36.3%

This is a secular change in the economy, and one that helps to explain why consumer fears can be much greater than they were when the overall unemployment rate was higher."

Me:

Part of what’s happening seems to be a shifting of employment away from the bubble industries. However, I also believe that there has been a Proactivity Run, with employers proactively shedding workers in anticipation of a deep bottom. In a way, this is like the so-called Paradox Of Thrift, in that decisions that make sense for an individual business hurt the overall economy. The Proactivity Run also explains the current rise in productivity, since the layoffs are outpacing the drop in demand.

Going forward, it is very possible that laying off so many workers is going to hurt businesses when the economy starts to turn. However, the worst news is that this Proactivity Run, a part of Fisher’s Debt-Deflation, has been going on since the middle of November, and getting a bit worse. That means that we are currently losing to Debt-Deflation, which is what we are purportedly trying to avoid. Whatever we’ve done so far hasn’t worked. That’s very bad news.

— Don the libertarian Democrat

Friday, February 6, 2009

More and more businesses are cutting jobs in anticipation of tougher times

From Real Time Economics:

"
Economists React: Jobs Report Shows ‘Slow Motion Train Wreck’

Economists and others weigh in on the January employment report, which showed a loss of nearly 600,000 jobs and a rise in the unemployment rate to 7.6%.

  • Another horrific report, showing job losses across the economy. Manufacturing jobs down a huge 207,000 — that’s a 1.6% drop in one month — construction down 111,000, retail down 45,000, business services down 121,000. The only private sector gain was in education and health. Household survey employment fell 1.239 million, the worst since records began in 1948. Only a dip in participation prevented an even bigger rise in the unemployment rate… If ever there were an economy in need of stimulus, this is it. –Ian Shepherdson, High Frequency Economics
  • There can be no sugar-coating this report. As suggested by the initial jobless claims data, the labor market remains in the grip of the worst jobs market since the 1981-82 recession, the rate of job losses massively intensified in November and there has been no change in trend since then… As for the seasonal distortion in January retail payrolls, it turns out that the retail payrolls declined despite an adjustment factor that added 687,000 to the retail employment change in January. –RDQ Economics
  • The January payroll report and the accompanying annual benchmark reinforced the impression of the slow motion train wreck that has become the U.S. economy… As one might expect the burden of the current increase in the rate of unemployment is disproportionately placed among young people and minorities. The unemployment rate among teenagers remained elevated at 20.8% while that among African-Americans jumped to 12.6% and Hispanics increased to 9.7%. Given the evolution of the employment data it does seem clear that the current expectation of a 9.0% rate of unemployment on the part of the Congressional Budget Office and the $43.0 billion in outlays on unemployment insurance in the stimulus, which may be voted on later today seems a bit on the optimistic side. –Joseph Brusuelas, Moody’s Economy.com
  • Massive hemorrhage is occurring from sea to shining sea in America and the recession is deepening. The loss of 3.6 million jobs in this recession has eliminated $360 billion in buying power in the economy. More and more businesses are cutting jobs in anticipation of tougher times. They want to trim fats and stay lean and mean for the tough times ahead. –Sung Won Sohn, Smith School of Business and Economics
  • Job losses are not only deepening but are becoming more broad-based, with the diffusion indexes of employment change, which show the net percentage of private sector industries adding to payrolls, at their lowest levels since the inception of the data… The reality is that, with the recession having intensified over the past few months, the credit markets still in a dysfunctional state, and business and investor confidence at rock bottom levels, even with the passage of a large fiscal stimulus package, whatever its merits may be, labor market conditions will continue to deteriorate through 2009, though the pace of decline will moderate as the year progresses, with the jobless rate likely rising into early 2010. –Richard F. Moody, Mission Residential
  • The employment report indicated that the labor market continues to deteriorate at a rapid clip… The latest unemployment claims data suggest that the pace of job loss may be accelerating in February. We look for the unemployment rate to continue to rise to about 9.75% by the end of 2009.–David Greenlaw, Morgan Stanley
  • There is no end in sight to the huge payroll declines, as high-profile lay-off announcements keep coming, and initial unemployment insurance claims have moved above 600,000 for the first time in this cycle. February might be even worse than January. We have now lost 3.6 million jobs since the cycle peak in December 2007, with 1.8 million lost in the last three months alone. We are heading for total job losses in the 6-7 million range and an unemployment rate well above 9%. –Nigel Gault, IHS Global Insight
  • The decline in payrolls flirted with the psychologically important 600,000 number for the third consecutive month. Based on the rising number of “real” (as opposed to liquidity-driven) bankruptcies in the retail sector, we see job losses accelerating for at least the next several months to the point where that 600,000 mark will soon be a dot in the distance behind us –Guy LeBas, Janney Montgomery Scott
  • Only about 12.7 million workers are employed by U.S. manufacturers, the fewest since February 1946. While this structural downtrend in manufacturing employment is likely to continue even after the recession ends, the steep job cuts accompanied by reductions in hours and overtime, indicate manufacturers are wasting no time cutting production in response to the sharp drop in total demand. That sort of adaptation makes it more likely that the overhang of inventories can be drawn down more quickly leaving the economy better poised to boost production if and when demand begins to improve. –David Resler, Nomura Securities
  • Compiled by Phil Izzo"

    Me:

    “More and more businesses are cutting jobs in anticipation of tougher times.”

    This is what’s happening. Employers are cutting jobs proactively in anticipation of a deep bottom. It’s a Proactivity Run. It is evident in Fisher’s Debt-Deflation. This also explains why productivity is rising.

    Since this run began in the middle of November, these figures mean that we are losing to Debt-Deflation. Since we’ve been trying to avoid this, what we’ve done hasn’t worked. Government needs to take bolder actions, including the Fed.

    Comment by Don the libertarian Democrat - February 6, 2009 at 2:36 pm

    But the government’s broader measure of unemployment hit a more stunning level: 13.9%, up from 13.5% in December.

    From Real Time Economics:

    "
    The Other Unemployment Rate: 13.9%

    The Labor Department’s official unemployment rate hit 7.6% in January, and its jump from 4.9% a year earlier marks the largest annual increase in the unemployment rate since 1975.

    But the government’s broader measure of unemployment hit a more stunning level: 13.9%, up from 13.5% in December.

    The figure, which largely accounts for people who have stopped looking for work or can’t find full-time jobs, is the highest since the Labor Department started the data series in 1994. It’s just shy of a discontinued and even broader measure that hit 15% in late 1982, when the official unemployment rate was 10.8%. (That data series goes back to the 1970s.)

    How does the government calculate two unemployment rates? The widely followed figure is based on people who do not have a job, are available for work and have actively looked for work in the prior four weeks. The official definition of “actively looking for work” includes contacting an employer, employment agency, job center or friends; sending out resumes or filling out applications; and answering or placing ads, among other things.

    The 13.9% unemployment rate — known as the “U-6″ for its Bureau of Labor Statistics classification — includes everyone in the official unemployment rate plus “marginally attached workers,” who are neither working nor looking for work but say they want a job and have looked for work recently, and people who are employed part-time for economic reasons — they want and are available for full-time work but took a part-time schedule because that’s all they could get.

    Because it’s a relatively young data series, the U-6 doesn’t get much attention beyond researchers. But it may deserve more focus over the coming year as the labor market continues its purge. Many employers are still focused on cutting jobs quickly to get through this downturn, pushing job-seekers aside for an extended period. After long searches — we’re in the fifteenth month of this recession — some job hunters are likely to give up and wait out the recession. Without the broader unemployment rate, many of them wouldn’t be counted. –Sudeep Reddy"

    Me:

    The total numbers are very important should you care about the stability of our political culture. If the total numbers go up over 15% and even approach 20%, it’s hard to imagine a lot of people accepting anything to do with the people and politics that got us here. We’d better be very generous to the unemployed and distressed workers, not simply for reasons of decency, but also for reasons of stability.
    Comment by Don the libertarian Democrat - February 6, 2009 at 11:50 am

    Clearly this kind of spike is scarily extreme, and equally clearly it's not showing any signs of slowing down.

    From Felix Salmon:

    "
    Chart of the Day: Spiking Unemployment

    Jake at EconomPic Data has the chart: narrow unemployment is now at 7.6%, while the broader measure of underemployment is a whopping 13.9%.

    Unemp1.jpg

    Clearly this kind of spike is scarily extreme, and equally clearly it's not showing any signs of slowing down. The AP does a good job of stating the obvious in its that's-weird-why-are-stocks-rising report:

    Jobs are important to the stock market because if people are unemployed, they aren't likely to maintain their spending, buy a house or keep up with their debt payments. And three of the biggest problems facing the economy are dampened consumer spending, the housing market's slide and accelerating loan defaults.

    Not to mention the fact that we're going to embark upon a wave of corporate debt defaults very soon now. It's all well and good to mark down bond prices to anticipate a higher default rate, but when it happens it's always a shock.

    I still think that things are going to get worse before they get worse: I just can't for the life of me see the engine for any recovery. Certainly the stimulus bill isn't going to do it on its own -- the economic problems facing the US are so large that the government can at best only try to make things slightly less bad than they otherwise might have been. But just as the boom fed on itself, so does the bust. Which means that this recession could drag on for a very long time yet."

    Me:

    This is very bad. With the Productivity numbers, this is evidence of a Proactivity Run ( Part of Fisher's Debt-Deflation ). In other words, employers are shedding workers in anticipation of a deep bottom and faster than the actual drop in demand. Of course, this has been happening since the middle of November.

    It's evidence that we've been putting in place the wrong responses. After all, we're trying to avoid Debt-Deflation and it keeps getting worse. I won't say what the correct policies should be, since no one cares, but people should really read Fisher to understand what we're up against.

    Friday, January 23, 2009

    “It’s a matter of the amount of fear in corporate boardrooms as companies position themselves defensively.”

    More on the Proactivity Run on Bloomberg:

    "By Bob Willis and Alex Tanzi

    Jan. 23 (Bloomberg) -- What’s shaping up to be the longest and deepest U.S. recession in at least a quarter century may swell the number of Americans collecting jobless benefits by half this year.

    As the economic slump approaches the depths of the contraction in the early 1980s, the 4.6 million workers currently receiving unemployment insurance checks may increase to as many as 7 million by the end of 2009, economists said.

    “There is no structural impediment to reaching the peaks in unemployment we saw in the early 1980s,” said Robert Dye, a senior economist at PNC Financial Services Group Inc. in Pittsburgh. “It’s a matter of the amount of fear( THIS IS THE KEY ) in corporate boardrooms as companies position themselves defensively( LAYING OFF WORKERS PROACTIVELY ).”

    The CHART OF THE DAY shows continuing jobless claims as a percent of total non-farm payrolls. At 3.4 percent, the latest reading (red circle) is well short of the 5.2 percent peak (green circle) reached in October 1982, toward the end of the recession to which the current downturn draws the most comparisons. With 135.5 million workers now on payrolls, another 2.4 million people would need to join the ranks of those receiving benefits to make today’s figures comparable to those from 26 years ago.

    The recession that began in December 2007 has so far cost 2.6 million jobs. The jobless rate will rise to 8.4 percent by the end of this year from 7.2 percent at the end of 2008, according to the median estimate of economists surveyed this month by Bloomberg News. Unemployment rose to 10.8 percent at the end of the 1982 downturn."

    We're not there yet.

    Sunday, January 18, 2009

    "The worst riots since the fall of Communism have swept the Baltics and the south Balkans."

    Ambrose Evans-Pritchard on the Telegraph:

    "Events are moving fast in Europe. The worst riots since the fall of Communism have swept the Baltics and the south Balkans. An incipient crisis is taking shape in the Club Med bond markets. S&P has cut Greek debt to near junk. Spanish, Portuguese, and Irish bonds are on negative watch.

    Dublin has nationalised Anglo Irish Bank with its half-built folly on North Wall Quay and €73bn (£65bn) of liabilities, moving a step nearer the line where markets probe the solvency of the Irish state.

    A great ring of EU states stretching from Eastern Europe down across Mare Nostrum to the Celtic fringe are either in a 1930s depression already or soon will be. Greece's social fabric is unravelling before the pain begins, which bodes ill.

    Each is a victim of ill-judged economic policies foisted upon them by elites in thrall to Europe's monetary project – either in EMU or preparing to join – and each is trapped.

    As UKIP leader Nigel Farage put it in a rare voice of dissent at the euro's 10th birthday triumph in Strasbourg, EMU-land has become a Völker-Kerker – a "prison of nations", to borrow from the Austro-Hungarian Empire.

    This week, Riga's cobbled streets became a war zone. Protesters armed with blocks of ice smashed up Latvia's finance ministry. Hundreds tried to force their way into the legislature, enraged by austerity cuts.

    "Trust in the state's authority and officials has fallen catastrophically," said President Valdis Zatlers,
    who called for the dissolution of parliament.

    In Lithuania, riot police fired rubber-bullets on a trade union march. Dogs chased stragglers into the Vilnia river. A demonstration outside Bulgaria's parliament in Sofia turned violent on Wednesday.

    These three states are all members of the Exchange Rate Mechanism (ERM2), the euro's pre-detention cell. They must join. It is written into their EU contracts.

    The result of subjecting ex-Soviet catch-up economies to the monetary regime of the leaden West has been massive overheating. Latvia's current account deficit hit 26pc of GDP. Riga property prices surpassed Berlin.

    The inevitable bust is proving epic. Latvia's property group Balsts says Riga flat prices have fallen 56pc since mid-2007. The economy contracted 18pc annualised over the last six months.

    Leaked documents reveal – despite a blizzard of lies by EU and Latvian officials – that the International Monetary Fund called for devaluation as part of a €7.5bn joint rescue for Latvia. Such adjustments are crucial in IMF deals. They allow countries to claw their way back to health without suffering perma-slump.

    This was blocked by Brussels – purportedly because mortgage debt in euros and Swiss francs precluded that option. IMF documents dispute this. A society is being sacrificed on the altar of the EMU project.

    Latvians have company. Dublin expects Ireland's economy to contract 4pc this year. The deficit will reach 12pc of GDP by 2010 on current policies. "This is not sustainable," said the treasury. Hence the draconian wage deflation now threatened by the Taoiseach.

    The Celtic Tiger has faced the test bravely. No government in Europe has been so honest. It is a tragedy that sterling's crash should have compounded their woes at this moment. To cap it all, Dell is decamping to Poland with 4pc of GDP. Irish wages crept too high during
    the heady years when Euroland interest rates of 2pc so beguiled the nation.

    Spain lost a million jobs in 2008. Madrid is bracing for 16pc unemployment by year's end.

    Private economists fear 25pc before it is over. Spain's wage inflation has priced the workforce out of Europe's markets. EMU logic is wage deflation for year after year. With Spain's high debt levels, this is impossible.

    Either Mr Zapatero stops the madness, or Spanish democracy will stop him. The left wing of his PSOE party is already peeling off, just as the French left is peeling off to fight "l'euro dictature capitaliste".

    Italy's treasury awaits each bond auction with dread, wondering if can offload €200bn of debt this year. Spreads reached a fresh post-EMU high of 149 last week. The debt compound noose is tightening around Rome's throat. Italian journalists have begun to talk of Europe's "Tequila Crisis" – a new twist.

    They mean that capital flight from Club Med could set off an unstoppable process.

    Mexico's Tequila drama in 1994 was triggered by a combination of the Chiapas uprising, a current account haemorrhage, and bond jitters. The dollar-peso peg snapped when elites began moving money to US banks. The game was up within days.

    Fixed exchange systems – and EMU is just a glorified version – rupture suddenly. Things can seem eerily calm for a long time. Politicians swear by the parity. Remember John Major's "soft-option" defiance days before the ERM blew apart in 1992? Or Philip Snowden's defence of sterling before a Royal Navy mutiny forced Britain off the Gold Standard in 1931.

    Don't expect tremors before an earthquake – and there is no fault line of greater historic violence than the crunching plates where Latin Europe meets Teutonia.

    Greece no longer dares sell long bonds to fund its debt. It sold €2.5bn last week at short rates, mostly 3-months and 6-months. This is a dangerous game. It stores up "roll-over risk" for later in the year. Hedge funds are circling.

    Traders suspect that investors are dumping their Club Med and Irish debt immediately on the European Central Bank in "repo" actions.

    In other words, the ECB is already providing a stealth bail-out for Europe's governments – though secrecy veils all.

    An EU debt union is being created, in breach of EU law. Liabilities are being shifted quietly on to German taxpayers. What happens when Germany's hard-working citizens find out?"

    I don't know if he correct. What interests me is the social disruption and dislocation being seen in the wake of this Calling Run ( Debt-Deflation Spiral, Deleveraging ). This is the main reason it is silly to allow the run to go on until it stops of its own will. By that time, the least of our problems will be economic. People who see free market ideology as the ideology that will be chosen at the end of this run are sadly mistaken. It is much more likely to be deemed the cause.

    Monday, January 12, 2009

    "I suspect that most people think both the Recession and Unemployment are worse now"

    The Big Picture with two good posts about the history of the Unemployment Rate:

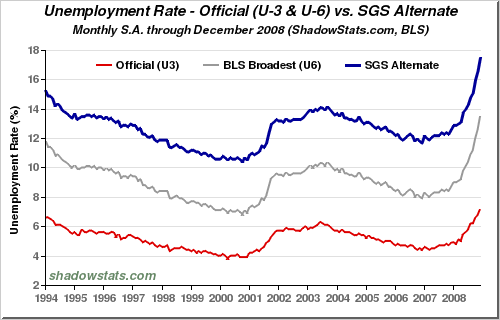
    "Here’s the worst case scenario of the U6 Unemployment Rate, as noted in this Reuters article, Great Depression jobs parallel may not be far flung. I disagree with the article, and believe we are nowhere near depression levels of unemployment.

    >

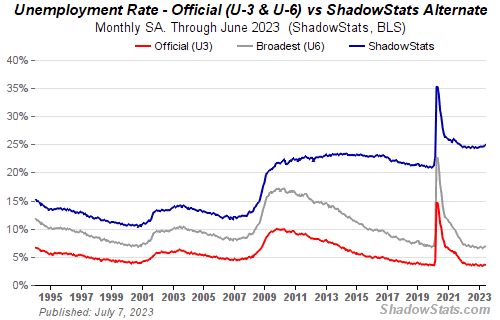
    The series by John Williams’ Shadow Stats folds back all of the workers who have left the Labor Pool. We do not know how many are actual workers and how many have simply left the labor pool, so that 17.5% number probably skews high.( TRUE )

    While I believe the 7.2% unemployment rate is laughably inaccurate, I do not think we are at 17.5% either . . .( I AGREE. BUT, AGAIN, GOVERNMENT NUMBERS ARE NOT NECESSARILY THE BEST NUMBERS. THEY ARE JUST THE NUMBERS THAT THE GOVERNMENT FINDS MOST USEFUL, FOR WHATEVER REASONS, IF ANY. )

    >

    Hat tip Paul

    >

    Source:
    Great Depression jobs parallel may not be far flung
    Pedro Nicolaci da Costa Reuters
    Jan 8, 2009 9:37pm EST
    http://www.reuters."

    Now, the second post:

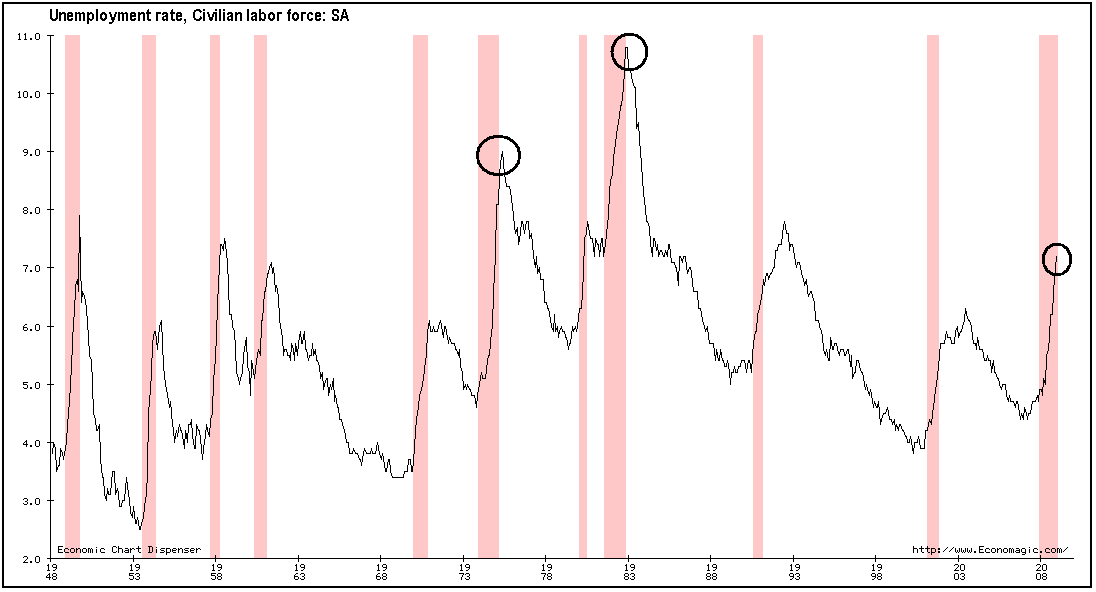
    "Is the economy better or worse than it was in the early 70s? How about early 80s? What about Unemployment?( ALL BETTER NOW )

    I suspect that most people think both the Recession and Unemployment are worse now than it was during either of those prior periods. ( I DISAGREE )

    If that is the case, than what are we to make of the following chart below? It shows Unemployment peaking (after) the ‘74 recession at ~9%, and unemployment peaking (after) the ‘82 recession at 11%. Here we are 12 months into this recession, with Unemployment just over 7%.

    I can think of several explanations for this anomaly: 1) The data is off( TRUE. BUT WE DON'T KNOW WHERE. ); 2) this recession is not as bad as those were( MY VIEW ); 3) structural changes in the economy mean less layoffs( MY VIEW ); 4) demographics are impacting people leaving the labor force, helping to keep UR lower( TRUE. A CASEY MULLIGAN POINT. ); 5) we have a lot further to run in terms of job losses( I HOPE NOT. ). Perhaps some combination of all 5 of these factors are involved. ( CORRECT )

    >
    click for ginormous chart

    via economagic"

    As you know, I believe that the economics of a given era are impacted by the context of the era. We are much better off today than in the past.

    Saturday, January 10, 2009

    If unemployment were being measured the same way as it was during the Depression, the U.S. would be well on its way to similar numbers.

    I like Paul Kedrosky on this story:

    "
    There's Unemployment, and Then There's Unemployme
    nt

    I have been sent this Reuters story from yesterday umpteen times, so I may as well post it, as well as the underlying graph. The gist: If unemployment were being measured the same way as it was during the Depression, the U.S. would be well on its way to similar numbers( IT'S HARD TO DETERMINE HOW ACCURATE THESE NUMBERS HAVE BEEN OVER TIME. ).

    Check the SGS line in the following graph from John Williams' ShadowStats:

    Chart of U.S. Unemployment

    Eye-opening, is it not?

    A few quick comments:

    • Unemployment by SGS's measure is at almost 18%, but it's also not been under 10% in recent history.
    • The whole idea of employment/unemployment has changed a great deal over time, with, for example, there being more part-time and flex work etc., messing with figures.( TRUE )
    • The existence of a social safety net has, for better or worse( IT'S BETTER ), made it possible for people to withdraw permanently from the workforce without having to live on the streets.
    • There is no denying that there are far more able-bodied people out of work than the skewed-low U.S. BLS figures purport to show." ( I AGREE )
    Government Stats are always of limited use since they are keyed to things like benefits and budgets. Again, Unemployment is not a good thing or a purgative.

    Wednesday, December 24, 2008

    "The second type of explanation is reduced labor supply. "

    Casey Mulligan with a post that irked a few readers, which is what I bet the NY Times wants. As usual, I'm going to take Casey's views and turn them into mine. I will take his Economic Points and turn them into my Political Economy Points. I doubt he'll mind, since he doesn't know:

    "
    Are Employers Unwilling to Hire, or Are Some Workers Unwilling to Work?

    Casey B. Mulligan is an economist at the University of Chicago.

    President-elect Barack Obama was not the first University of Chicago professor to serve in the United States Senate. More than 50 years ago, a professor named Paul Douglas became a United States senator representing Illinois.

    As an economics professor, Professor Douglas wrote about the supply and demand for labor. Some of his techniques can lead us to a surprising conclusion about today’s recession: The recent decrease in employment may be due less to employers’ unwillingness to hire more workers( DEMAND ) and more to workers’ unwillingness to work( SUPPLY ).

    As you’ve probably heard, employment has been falling over the past year. After peaking in December 2007, employment fell 1.4 percent over the next 11 months. Hours per employee also fell. As a result, if total hours worked had continued the upward trend they had been on in the years before the recession, they would be 4.7 percent higher than they are now.

    Explanations for the decline — like most everything in economics — can be classified in two ways: supply or demand.

    In many recessions, the demand for labor gets much of the blame. The demand explanation says that, with orders for their products down, many companies have trouble finding productive uses for employees. Some workers are then let go( I SAY THAT THIS IS HAPPENING OUT OF FEAR ). In this view, productivity — the amount produced per hour worked — should decline because reduced productivity is a driving force of layoffs. (Gross domestic product thereby declines for two reasons: fewer workers and less productivity per worker.)

    Indeed, hourly productivity did decline in the 1981-82 recession, falling three out of four quarters for a cumulative peak-to-trough decline of 2.3 percent. Productivity fell faster and longer during the Depression.

    The second type of explanation is reduced labor supply( SUPPLY ).

    Suppose, just for the moment, that people were less willing to work, with no change in the demand for their services. This means that employees would have to be more productive because they have to get by with fewer workers.

    Of course, people have not suddenly become lazy, but the experiment gives similar results to the actual situation in which some employees face financial incentives that encourage them not to work and some employers face financial incentives not to create jobs( HERE'S WHERE I SEE THE PROBLEM ).

    Professor Douglas gave us a formula for determining how much output per work hour would increase as a result of a reduction in the aggregate supply of hours: For every percentage point that the labor supply declines, productivity would rise by 0.3 percentage points.

    As mentioned earlier, in late 2008, labor hours were 4.7 percent below where trends from previous years would predict the number to be. According to Professor Douglas’s theory, this means productivity should rise 1.4 percent above its previous trend by the fourth quarter.

    So let’s take a look at the numbers. Unlike in the severe recessions of the 1930s and early 1980s, productivity has been rising( TRUE ). Through the third quarter of 2008, productivity had risen six consecutive quarters, with an increase of 1.9 percent over the past three, or 0.7 percent above the trend for the previous 12 quarters.

    Because productivity has been rising — almost as much as the Douglas formula predicts — the decreased employment is explained more by reductions in the supply of labor (the willingness of people to work) and less by the demand for labor (the number of workers that employers need to hire).

    Why would some people have fewer incentives to take a job in 2008 than they did in 2006 and 2007 (and employers fewer incentives to create jobs)?

    I will tackle that question in my next post, but even without a specific answer we learn a lot about today’s recession from the conclusion that labor supply – not labor demand – should be blamed. First of all, it suggests that a fundamental solution to the recession would encourage labor supply (perhaps cutting personal income tax rates, so people can keep more of their wages), rather than tinker with demand.

    Second, the recent supply reduction may be more short-lived than the demand reductions of past severe recessions. In particular, as people adjust to the reality of depleted retirement accounts and vanished home equity, many of them will decide to make up for some of the shortfall by working more and retiring later.

    And on another note, the department of economics at the University of Chicago does not conform to stereotypes: Professor Douglas ran for senator on the Democratic Party ticket and was occasionally accused of being a socialist. I teach his formula frequently and with admiration."

    I take the rising productivity and rising unemployment to show that many people are proactively and needlessly being laid off out of fear and aversion to risk. There is rising Productivity because the Demand is still the same, yet there are fewer workers. And there are fewer workers because the layoffs are due to the fear and aversion to risk.

    The reason that the fear and aversion to risk mimics the behavior of an increase in the supply of workers, is because workers are being proactively and needlessly let go, not due to the fundamentals of supply and demand. It is a case of employers misreading and misdirecting the supply and demand now prevailing. After all, in order for supply and demand to work, it has to be perceived by acting human agents.

    So, my thesis is that letting people go because you assume that demand will decrease, when demand doesn't decrease, leads to a rise in productivity and a seeming rise in labor supply, which it is, only not because the workers don't want to work, but because the employers have proactively and erroneously let them go, from misperceiving the demand.

    It would follow that things might be better than we think, and that employers might soon realize the need for extra workers. At least that's the hope.

    Conversely, some kind of stimulus of demand would work, since employers would soon perceive the need for more workers. I leave the details of the stimulus for another time.

    "Consumer spending in the U.S. fell less than forecast"

    Interesting news on Bloomberg:

    "By Bob Willis and Courtney Schlisserman

    Dec. 24 (Bloomberg) -- Consumer spending in the U.S. fell less than forecast as cheaper gasoline left Americans with more cash( GOOD NEWS ), while jobless claims climbed to a 26-year high( BAD NEWS ), signaling purchases will keep sliding into 2009.

    Spending dropped 0.6 percent in November, and rose for the first time in six months after accounting for inflation, the Commerce Department said today in Washington. First-time unemployment benefit claims jumped to 586,000( BAD NEWS ), and durable-goods orders declined less than anticipated( GOOD NEWS ), other reports showed.

    The deteriorating job market means consumers will probably further rein in spending( TRUE ); economists including those at Morgan Stanley estimate more than 400,000 people will lose their jobs this month. The outlook forced Sears Holdings Corp., the largest U.S. department-store company, earlier this month to abandon its earnings forecast for the rest of the year.

    “The economy continues to struggle and unfortunately the first half( I AGREE ) of 2009 does not look very good,” said Carl Riccadonna, a senior U.S. economist at Deutsche Bank Securities Inc. in New York. “We look for a further contraction and a continued acceleration in the pace of layoffs.”

    Gasoline prices fell by a total of 50 percent in October and November, and discounts by retailers from Toys “R” Us Inc. to Wal-Mart Stores Inc. helped prevent a bigger drop in purchases last month. Today’s Commerce report also showed that the gain in spending adjusted for inflation was the biggest in almost two years( GOOD NEWS ).

    Spending Outlook

    “The increase in real spending is unlikely( UNLIKELY IS FINE ) to be sustained with the job losses we are seeing,” said Benjamin Reitzes, an economist at BMO Capital Markets in Toronto. The gain last month “was more a technicality based on the drop in gasoline prices( HOWVER<>

    Stocks were little changed after today’s reports. The dollar remained lower, while Treasuries advanced. The Standard & Poor’s 500 Stock Index was up 0.2 percent at 864.56 at 10:14 a.m. in New York, benchmark 10-year note yields slipped to 2.17 percent from 2.18 percent late yesterday, and the dollar lost 0.5 percent against the euro to $1.3994.

    A separate Commerce report showed orders for durable goods in November fell 1 percent( NOT BAD ), after an 8.4 percent decrease in October that was bigger than previously reported. Excluding a slump in transportation gear, orders for goods designed to last several years unexpectedly increased.

    Capital Goods

    Bookings for non-defense capital goods excluding aircraft, a measure of future business investment, increased 4.7 percent( GOOD NEWS ), the most since September 2006, after a 6.6 percent slump in October. Shipments of those items, used in calculating gross domestic product, rose 0.2 percent( GOOD NEWS ).

    “Orders were so down in the previous months that there’s probably a little payback for that( WE'LL TAKE IT. HOWEVER, THIS WOULD SUPPORT MY VIEW THAT WE WENT DOWN MORE THAN WE WOULD FUNDAMENTALLY HAVE DUE TO THE FEAR AND AVERSION TO RISK ),” Robert Stein, senior economist at First Trust Advisors in Lisle, Illinois, said before the report.

    Today’s Labor Department report showed that the four-week moving average of claims, a less volatile measure, also was the highest since 1982, at 558,000 for the week to Dec. 20. Initial claims were projected to increase to 558,000, according to the median of 32 forecasts in a Bloomberg News survey.

    The number of people staying on benefit rolls fell to 4.37 million in the week ended Dec. 13 from 4.387 million.

    Rising joblessness contributed to a drop in personal income last month. The Commerce figures showed income fell 0.2 percent in November after being unchanged the prior month( NOT GOOD ).

    Hit to Income

    “Given the further increase in jobless claims,” wage and salary income “is likely to further decelerate in the near term,” Deutsche’s Riccadonna wrote in a note to clients.

    The drop in consumer spending last month extended declines to a record fifth consecutive decline, the Commerce Department said. Economists forecast unadjusted spending would fall 0.7 percent, according to the median of 64 estimates in a Bloomberg News survey.

    Today’s report also confirmed inflation is retreating as demand wanes. Prices plunged 1.1 percent, also the biggest since records began in 1992. The gauge increased 1.4 percent from November 2007, the smallest gain in six years. The Fed’s preferred price measure, which excludes food and fuel, was unchanged for the second consecutive month, the first time that’s happened since 1999.( TRUE )

    Gasoline Price

    The average price of unleaded regular gasoline at the pump fell by $1 to $2.11 in November from the prior month, according to AAA, leading the drop in overall prices.

    The decrease in spending pushed the savings rate up to 2.8 percent from 2.4 percent in October. A positive rate suggests consumers are restraining spending to boost savings( THIS RATE IS FINE ).

    Even after the bump in November sales, retailers are concerned about the holiday shopping season, which brings in one- third or more of annual revenue. The International Council of Shopping Centers and Goldman Sachs Group Inc. said yesterday that November-December sales may fall as much as 2 percent. The ICSC had previously projected a drop of as much as 1 percent.

    “Given the current economic and retail environment, we will carefully evaluate alternatives that provide financial flexibility in the near-term,” Sears’s interim Chief Executive Officer W. Bruce Johnson said in a statement.

    Consumer spending dropped at a 3.8 percent annual pace in the third quarter( NOT GOOD ), the biggest plunge since 1980, revised Commerce figures showed yesterday. The economy shrank 0.5 percent. Economists surveyed by Bloomberg forecast the economy will contract through the first half of 2009."

    A better report than expected.

    Wednesday, October 29, 2008

    "According to the researchers, the revised index doesn’t do a better job of reflecting presidential approval ratings than the original."

    So, now, along with the Consumer Confidence Index, which is at its lowest point in history, and the VIX is to to its highest point in decades, and the Misery Index is the highest it's been since 1982:

    "By any measure, the U.S. is pretty miserable right now.

    misery_cs_20081029100445.jpg
    Source: Peterson Institute

    Yesterday, the Conference Board reported that the consumer confidence index hit the lowest level in its history. The was presaged by a rise in the so-called misery index. The measure was created by Arthur Okun in the 1970s and consists of adding the inflation rate to the unemployment rate. The index was at 13.5 in the first half of the year. That isn’t a historical high, but was the highest level seen since 1982.

    As inflation starts to recede and the misery index retreats, Gary Hufbauer, Jisun Kim and Howard Rosen of the Peterson Institute propose a revised version of the misery index that includes asset price measures. “Building on these commonplace observations, we tried adding a housing price index and the S&P 500 index to Okun’s two original components, inflation and unemployment,” they wrote."

    I'm willing to base a derivative on any of these indices:

    "Essentially any risk that has an objectively observable event and an objectively measureable associated magnitude can be assigned a financial component and allocated using a derivative contract. There are derivative markets for risks tied to weather, energy products, interest rates, currency, etc. Wherever there is a business or regulatory motivation, financial products will appear to meet the demand."

    Any takers?