"Some bonds have done well, some bonds have done exceedingly well and some bonds have done poorly during 2008. The credit crisis sent Treasuries into potentially bubble territory( I AGREE ), and below investment grade bonds into the cellar.
When market conditions normalize, it may be reasonable to assume that “scared” money( I AGREE THAT'S WHAT IT IS ) hiding in Treasuries will flow out and into credit bonds( INTO SOMETHING ELSE ). That would probably cause rates on Treasuries to rise and prices to fall, while causing rates on credit bonds to fall and prices to rise( A GOOD BET ). However, not much about credit markets in 2008 was as expected, so we’ll just have to wait and see. Watching the charts may help clarify the situation.
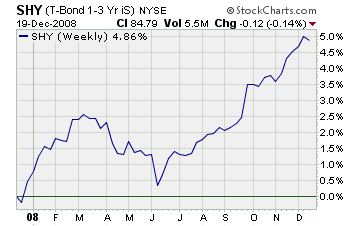
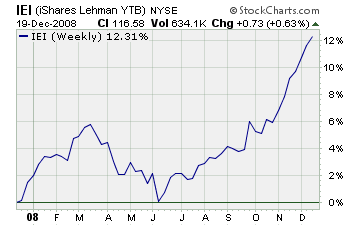
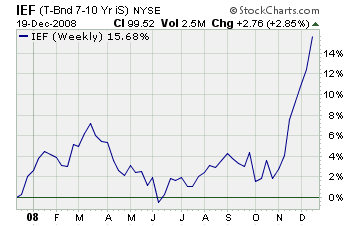
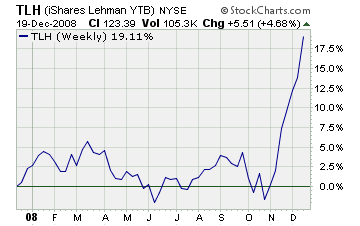
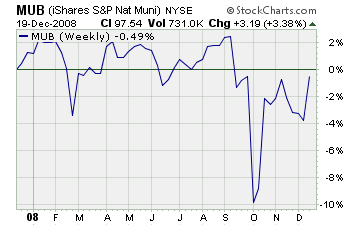
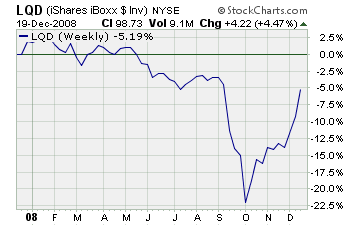
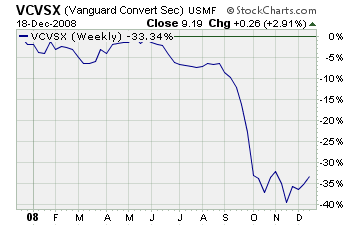
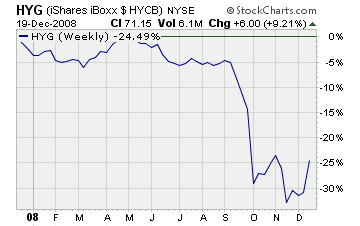
Here are 2008 weekly percentage performance charts for fifteen key types of US and non-US bond index funds:
1-3 Year US Treasuries
3-7 Year US Treasuries
7-10 Year US Treasuries
10-20 Year US Treasuries
20+ Year US Treasuries
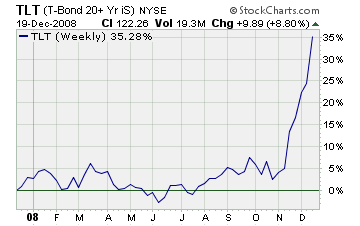
Inflation Protected US Treasuries
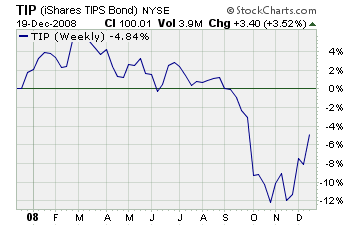
US GNMA Bonds
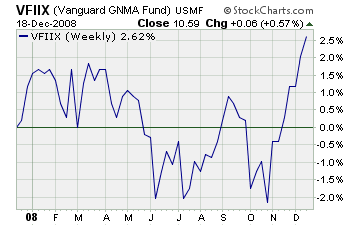
US Mortgage-Backed Securities
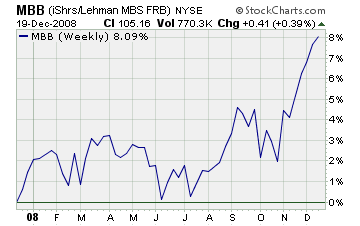
US National Municipal Bonds
US Investment Grade Corporate Bonds
US Convertible Bonds
US Below Investment Grade (High Yield) Bonds
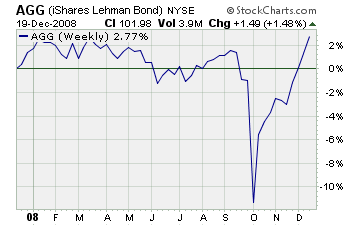
US Aggregate Bonds
(all excluding muni’s and <>
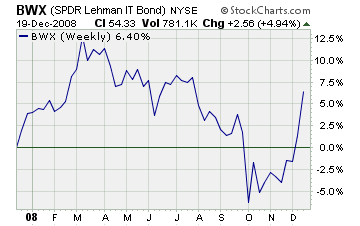
Non-US Developed Country Investment Grade Treasuries
(local currency denominated)
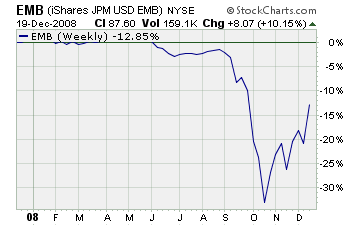
Emerging Market Sovereign & Agency Bonds
(USD denominated)


No comments:
Post a Comment